Fusedash vs StatPecker
Side-by-side comparison to help you choose the right AI tool.
Fusedash transforms raw data into interactive dashboards and charts, empowering teams to act on insights instantly.
Last updated: March 4, 2026

StatPecker
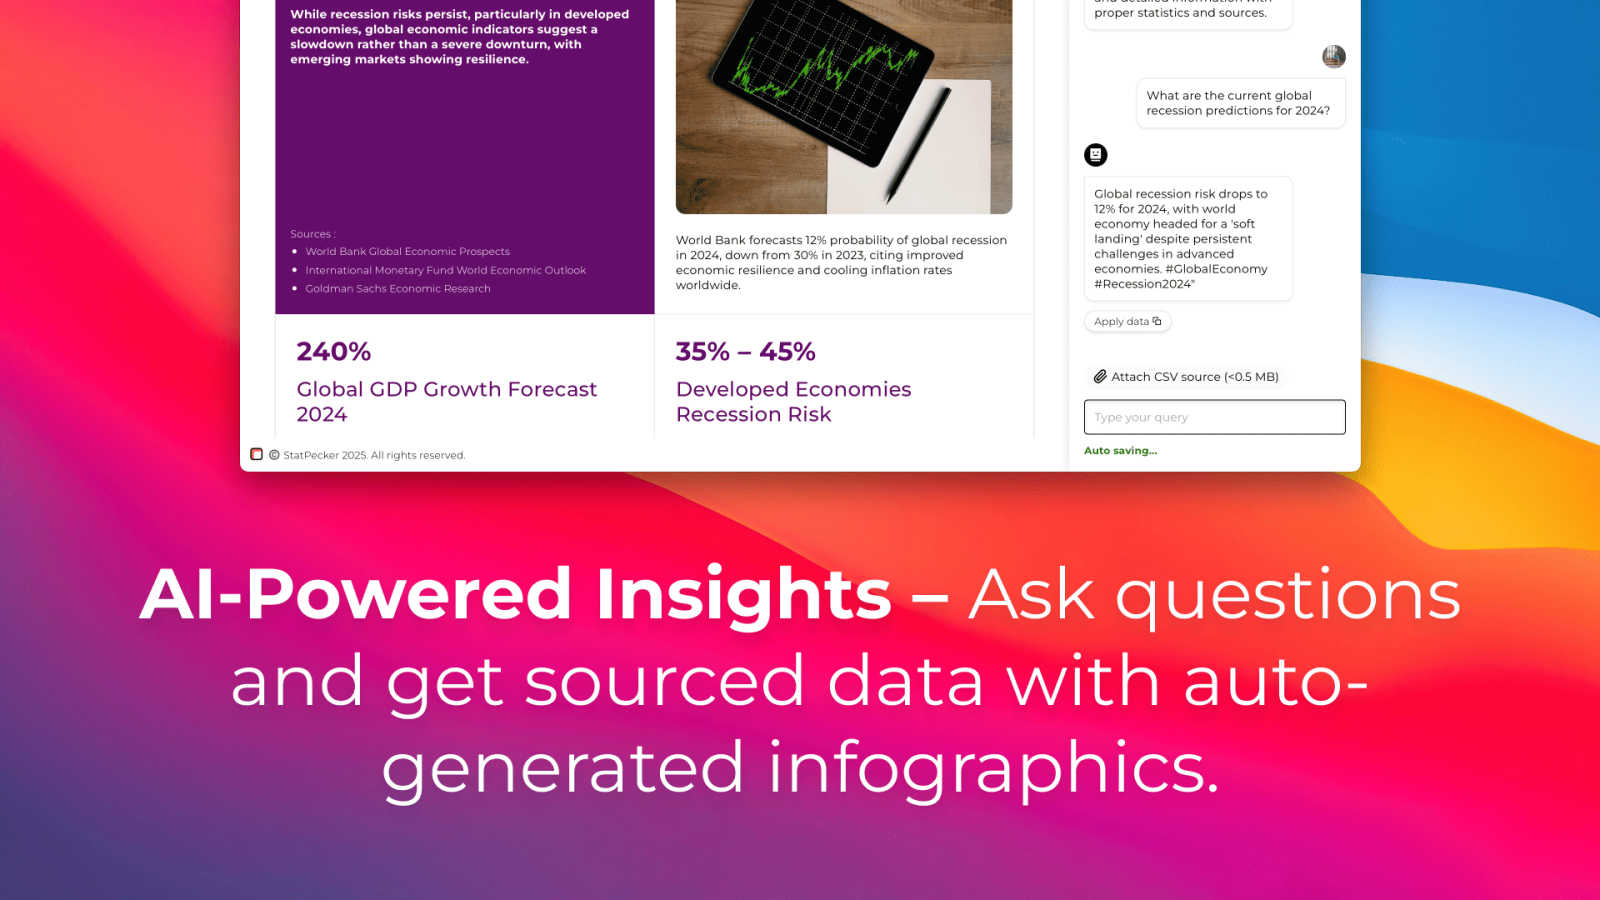
StatPecker turns your company data into quick insights and stunning visuals, empowering better decisions and.
Last updated: March 1, 2026
Visual Comparison
Fusedash

StatPecker
Feature Comparison
Fusedash
Flexible Views
Fusedash offers the ability to create tailored dashboards, charts, maps, and report-style views from the same dataset, catering to the unique needs of various teams. This flexibility minimizes back-and-forth communication, ensuring that stakeholders receive precisely the information they need without extra hassle. Users can customize layouts, filters, and time ranges, allowing for a streamlined data presentation across the organization.
AI Chart Generator
With Fusedash's AI Chart Generator, users can produce clear and informative visuals from their data in mere minutes. This feature enables quick selections of chart types, application of comparisons, and refinement of labels, ensuring that each chart effectively tells its story. Users have the option to integrate these charts into dashboards or utilize them as standalone visuals for specific reporting needs.
Dashboard Software
Fusedash centralizes dashboards and reporting into one cohesive workspace, making it easier for teams to monitor KPIs while providing essential context. By combining performance metrics with narrative storytelling, users can clearly communicate what has changed, why it matters, and what actions should follow. This integration helps to maintain alignment across teams and reduces discrepancies in reporting versions.
AI Chat
The Smart Chat feature of Fusedash revolutionizes data exploration by allowing users to ask questions in plain language. This functionality not only helps users navigate their data more efficiently but also provides suggestions for optimal metrics, charts, and breakdowns. The insights gained can be effortlessly transformed into shareable views within dashboards, thereby enhancing collaboration and understanding among team members.
StatPecker
Ask Your Query
With StatPecker’s intuitive interface, users can ask questions and receive instant insights from validated sources. This feature eliminates the need for complex tools and allows users to focus on their data stories rather than the intricacies of data analysis.
Publish & Embed
StatPecker makes it easy to create interactive visuals that can be seamlessly integrated into blogs, articles, and websites. This feature ensures that users can share their insights effectively, enhancing content with visually appealing graphics that captivate audiences.
Upload & Analyze CSVs
This feature allows users to upload local CSV files and extract key insights without the hassle of traditional spreadsheets. Users can analyze their data securely on their devices, making it a private and efficient way to derive meaningful conclusions from their datasets.
Download & Use Anywhere
Users can export their infographics as images, making it simple to include them in reports, presentations, and other formats. This flexibility ensures that StatPecker’s visuals can be utilized across various platforms, enhancing the reach and impact of the information presented.
Use Cases
Fusedash
Marketing Analysis
Marketing teams can leverage Fusedash to create dynamic dashboards that track campaign performance, customer engagement, and ROI. By visualizing data in real-time, marketers can make informed decisions and adjust strategies promptly, ensuring that resources are allocated effectively.
Financial Reporting
Finance departments can utilize Fusedash to generate detailed financial reports that combine historical data with real-time insights. By standardizing KPIs and metrics, finance teams can ensure consistent reporting across departments, leading to more accurate forecasting and budgeting.
Sales Performance Monitoring
Sales teams can benefit from Fusedash's interactive dashboards to monitor sales performance and pipeline metrics. By visualizing data by region, product, or sales rep, teams can quickly identify trends and areas for improvement, facilitating timely interventions.
Operations Management
Operations teams can use Fusedash to track key operational metrics, such as supply chain efficiency and production timelines. By integrating various data sources into a single view, teams can optimize processes and respond quickly to any operational challenges.
StatPecker
Content Creation
Writers and content creators can leverage StatPecker to enrich their articles with visually engaging infographics that help convey complex data clearly. This not only enhances reader engagement but also establishes credibility through data-driven storytelling.
Business Reporting
Analysts and business professionals can use StatPecker to transform raw data into insightful visuals for reports and presentations. This feature facilitates clearer communication of trends and performance metrics, enabling data-driven decision-making processes.
Educational Purposes
Educators can utilize StatPecker to create interactive educational materials that simplify complex topics for students. By visualizing data in an engaging manner, teachers can improve comprehension and retention of key concepts.
Marketing Insights
Marketers can harness StatPecker to visualize market trends and consumer behavior effectively. This enables teams to present compelling data to stakeholders, enhancing strategies with insights that drive marketing campaigns and initiatives.
Overview
About Fusedash
Fusedash is an innovative AI-powered data visualization platform that empowers teams to transform their connected data into insightful and actionable visuals. Designed for organizations tired of juggling multiple, disconnected tools, Fusedash serves as a unified workspace where users can create decision-ready dashboards, interactive charts, detailed maps, and narrative reports—all without the hassle of rebuilding logic across various platforms. Its main value proposition lies in delivering consistency and efficiency; users define key metrics and KPIs once, ensuring that everyone from leadership to marketing to operations references the same reliable numbers. With features that facilitate real-time monitoring and deep data exploration, Fusedash not only helps teams stay aligned but also fosters a deeper understanding of data trends and narratives. Integrated AI functionalities, including natural language data chat and smart visualization assistance, further streamline the data reporting process, making it faster and more accessible. Fusedash is not just about monitoring; it is about understanding the "why" behind the data, enabling organizations to take informed actions based on a shared source of truth.
About StatPecker
StatPecker is an innovative AI-powered tool that transforms the way individuals and teams visualize data. Designed for a diverse audience that includes content creators, analysts, marketers, and educators, StatPecker takes raw datasets and converts them into stunning infographics in seconds. This tool alleviates the burden of manual reporting and eliminates the costs associated with hiring professional designers. Its main value proposition lies in its ability to deliver insightful and interactive visuals that enhance understanding and engagement. Whether you are enriching articles, improving business reports, or creating educational content, StatPecker provides quick, credible answers that can be easily shared and published. With features that streamline data storytelling, it empowers users to make informed decisions and effectively communicate insights, making it an essential tool for anyone who works with data.
Frequently Asked Questions
Fusedash FAQ
What types of data can I connect to Fusedash?
Fusedash allows users to connect a variety of data sources, including CSV files, APIs, and public datasets. This flexibility enables teams to consolidate their data into a single platform for comprehensive analysis and reporting.
How does Fusedash ensure data consistency across reports?
Fusedash enables users to define key metrics and KPIs once, ensuring that these definitions are reused across all dashboards and reports. This consistency fosters trust in the data and reduces discrepancies in reporting.
Can I customize the visualizations in Fusedash?
Absolutely! Fusedash provides users with extensive customization options for dashboards, charts, and maps. Users can modify layouts, apply filters, and define time ranges to tailor their visualizations according to specific audience needs.
Is there a way to automate reporting in Fusedash?
Yes, Fusedash supports automated reporting through its integrated features, allowing users to set refresh schedules for their datasets. This ensures that reports reflect the most current data without manual intervention, saving time and reducing errors.
StatPecker FAQ
How does StatPecker ensure data privacy?
StatPecker processes data locally on your device, which means your information remains private and secure during analysis. This feature is particularly beneficial for users concerned about data confidentiality.
Can I use StatPecker for free?
Yes, StatPecker offers a free tier that allows users to create unlimited projects, embed visuals, and conduct a limited number of AI queries and CSV uploads. This is a great way to explore the tool’s capabilities without any initial investment.
What types of files can I upload?
Users can upload CSV files of up to 50 MB to analyze their data. This allows for a wide range of data inquiries, making it easier to derive insights from various datasets.
Is StatPecker suitable for beginners?
Absolutely! StatPecker is designed with user-friendliness in mind. Its intuitive interface and straightforward features make it accessible for individuals at all skill levels, from beginners to expert analysts.
Alternatives
Fusedash Alternatives
Fusedash is an innovative AI-powered data visualization platform that helps teams convert their raw data into clear dashboards and charts, streamlining the decision-making process. As part of the Analytics & Data and Business Intelligence categories, Fusedash provides a unified workspace for users to create interactive visualizations without the hassle of navigating through multiple disconnected tools. Users often seek alternatives to Fusedash for various reasons, such as pricing constraints, specific feature requirements, or the need for compatibility with existing platforms. When exploring alternatives, it's essential to consider factors like ease of use, the ability to customize metrics and KPIs, integration capabilities with other tools, and the overall cost-effectiveness of the solution. Choosing the right platform can significantly enhance data-driven decision-making and foster organizational alignment.
StatPecker Alternatives
StatPecker is an innovative AI-powered tool designed to transform company data into quick insights and visually stunning infographics. It falls under the category of analytics and data visualization, catering to a diverse audience that includes content creators, analysts, marketers, and educators. Users often seek alternatives to StatPecker for various reasons, such as pricing concerns, specific feature requirements, or compatibility with different platforms. When exploring alternatives, it’s essential to consider factors like ease of use, the quality of visuals produced, integration capabilities, and the overall cost-effectiveness of the solution. When choosing an alternative, prioritize tools that not only meet your immediate data visualization needs but also offer scalability for future growth. Look for user-friendly interfaces that allow for seamless interaction and efficient data analysis, as well as robust sharing and embedding options to enhance your content's reach. Ultimately, the right alternative should empower you to communicate your data-driven insights effectively without getting bogged down in the complexities of manual reporting or design.