

LoadTester
LoadTester lets you run HTTP and API load tests from browser or CI with live analytics and no infrastructure to manage.
About LoadTester
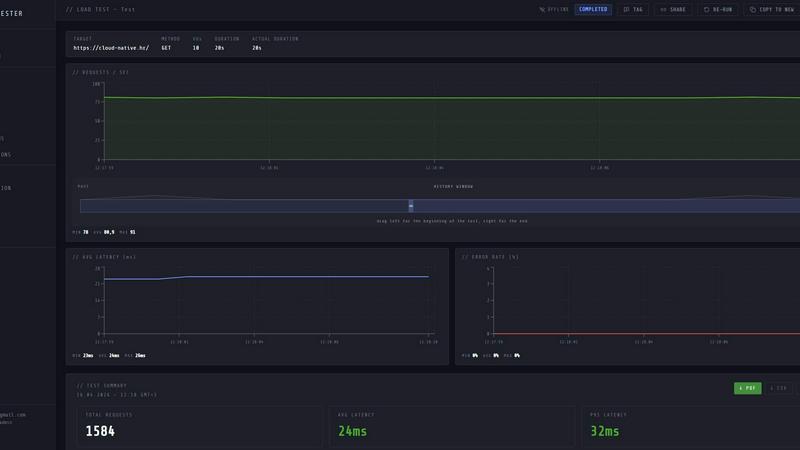
LoadTester is a modern HTTP and API load testing tool built for engineering teams who need repeatable performance checks without the overhead of managing infrastructure. At its core, this product lets you create, launch, and analyze load tests directly from your browser or CI/CD pipeline, with live analytics, p95/error-rate thresholds, scheduled baselines, and run-to-run comparisons. It is designed for developers, QA engineers, and platform teams who want to catch performance regressions before users notice them, all without provisioning servers, orchestrating workers, or dealing with complex setup ceremonies. The tool supports both virtual users (VUs) and requests per second (RPS) modes, giving you flexibility in how you simulate traffic. You can monitor throughput, latency, active users, and error rates in real time while a test runs, then review a clean summary of total requests, average latency, p95, data sent, and data received. LoadTester also includes exports to PDF, CSV, or JSON, scheduled tests, API access, and workflow integrations for teams that want simple, repeatable performance checks. It is built by Cloud Native d.o.o. and is designed for scale, performance, and reliability, with a cold start of under three seconds, support for up to 10,000 virtual users per test, and a maximum throughput of 10,000 requests per second. A free plan is available, making it accessible for small projects and teams exploring performance testing.
Features of LoadTester
Instant Execution, Distributed by Default
Start distributed load tests in seconds without any infrastructure setup, worker orchestration, or scheduling headaches. The system boots in under three seconds, auto-scales workers as needed, and has zero queue time for test execution. Your team focuses on interpreting results and optimizing performance, while LoadTester handles worker scaling, infrastructure coordination, and execution flow behind the scenes.
Live Telemetry and Real-Time Analytics
Watch requests, latency, failures, throughput, and bottlenecks update in real time while your test is running. The live dashboard shows RPS, p50, p95, p99 latency, error counts, and active virtual users, all streaming continuously. This immediate feedback loop lets you spot performance anomalies as they happen, rather than waiting for a post-run report to discover issues.
Smart Auto-Stop with Thresholds
Set failure or latency thresholds that automatically stop tests when things go sideways. You can configure auto-stop conditions based on p95 latency exceeding a target, error rate surpassing a percentage, or regression compared to a baseline run. When a threshold is breached, the test halts immediately, preventing wasted resources and alerting your team to problems right away.
CI/CD Ready with Webhooks and Alerts
Integrate performance testing directly into your deployment pipeline with webhooks, Slack notifications, and email alerts. Run tests on every deploy, schedule nightly release gates, and post result links to release bots automatically. The API access lets you trigger tests programmatically, fetch results, and compare runs without manual intervention, making performance validation a seamless part of your workflow.
Use Cases of LoadTester
Pre-Deployment Performance Gate
Before shipping a new release to production, engineering teams can run a scheduled load test against staging or canary environments. By setting p95 latency and error rate thresholds, the test acts as a performance gate that automatically stops if metrics degrade beyond acceptable limits. This catches regressions before they reach users, giving teams confidence that new code or infrastructure changes won't cause slowdowns or outages.
Spike Testing for High-Traffic Events
When preparing for events like product launches, flash sales, or seasonal traffic spikes, teams can simulate sudden bursts of requests to ensure their application can handle the load. LoadTester's distributed execution mode allows you to ramp up to thousands of virtual users in seconds, monitoring live how your system responds to the spike. You can identify bottlenecks in database connections, caching layers, or API endpoints before real users experience issues.
Continuous Performance Monitoring in CI/CD
Integrate load testing into your continuous integration and deployment pipeline to automatically validate performance on every commit or pull request. With webhooks and API access, you can trigger a baseline test, compare results against previous runs, and fail the pipeline if performance degrades. This makes performance testing a routine part of development, not a separate manual step that gets skipped under time pressure.
Capacity Planning and Infrastructure Validation
When migrating to new infrastructure, scaling services, or changing cloud providers, teams need to validate that the new environment can handle expected traffic. LoadTester lets you run controlled tests against different configurations, compare run-to-run results, and export data for analysis. By understanding how your system behaves under various load levels, you can make informed decisions about resource allocation, instance sizing, and scaling policies.
Frequently Asked Questions
How does LoadTester handle distributed load testing without requiring infrastructure setup?
LoadTester manages all worker scaling, infrastructure coordination, and execution flow on its platform. When you launch a test, the system automatically provisions and dispatches workers across multiple nodes, booting in under three seconds. You do not need to set up servers, configure load generators, or manage orchestration tools. The platform handles the complexity so you can focus on analyzing results and improving performance.
What types of tests can I run with LoadTester?
You can run HTTP and API load tests using GET, POST, PUT, and DELETE methods. The tool supports two modes: Virtual Users (VUs) for simulating concurrent user sessions, and Requests Per Second (RPS) for targeting a specific throughput rate. You can configure test duration, ramp-up patterns, and target URLs. The platform is designed for modern web applications and microservices, making it suitable for testing REST APIs, GraphQL endpoints, and web services.
Can I automate my load tests and integrate them with my existing tools?
Yes, LoadTester provides API access, webhooks, Slack notifications, and email alerts for full automation and integration. You can trigger tests programmatically from your CI/CD pipeline, fetch results in JSON format, and set up webhooks to post result links to release bots. Scheduled tests let you run performance checks at regular intervals, such as nightly release gates or pre-deployment validations, without manual intervention.
What happens when a test breaches a threshold?
When a test breaches a configured threshold, such as p95 latency exceeding a target or error rate surpassing a limit, LoadTester can automatically stop the test to prevent wasted resources and further degradation. It also triggers notifications via Slack, email, or webhooks to alert your team immediately. You can configure multiple thresholds per test, including regression comparisons against baseline runs, giving you fine-grained control over when and how to stop tests.
Similar to LoadTester


Firma.dev
Pay-as-you-go e-signature API and no-code sending. €0.049 per envelope, no monthly minimums, legally valid in 55+ countries.


AIQualityHQ
Explore how AIQualityHQ instantly evaluates your prompts across six dimensions to uncover hidden risks and sharpen your AI inputs.