StatPecker vs TrafficClaw
Side-by-side comparison to help you choose the right AI tool.

StatPecker
StatPecker turns your company data into quick insights and stunning visuals, empowering better decisions and.
Last updated: March 1, 2026
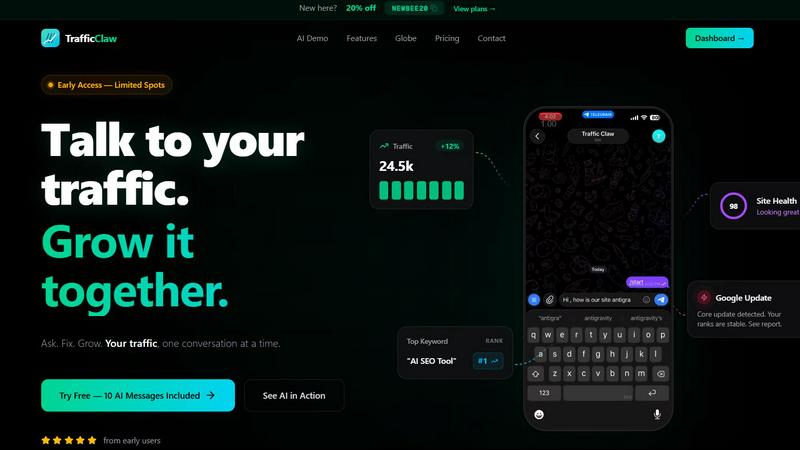
TrafficClaw
TrafficClaw is your AI analyst that answers questions about your real SEO and traffic data to help you grow.
Last updated: April 13, 2026
Visual Comparison
StatPecker

TrafficClaw
Feature Comparison
StatPecker
Ask Your Query
With StatPecker’s intuitive interface, users can ask questions and receive instant insights from validated sources. This feature eliminates the need for complex tools and allows users to focus on their data stories rather than the intricacies of data analysis.
Publish & Embed
StatPecker makes it easy to create interactive visuals that can be seamlessly integrated into blogs, articles, and websites. This feature ensures that users can share their insights effectively, enhancing content with visually appealing graphics that captivate audiences.
Upload & Analyze CSVs
This feature allows users to upload local CSV files and extract key insights without the hassle of traditional spreadsheets. Users can analyze their data securely on their devices, making it a private and efficient way to derive meaningful conclusions from their datasets.
Download & Use Anywhere
Users can export their infographics as images, making it simple to include them in reports, presentations, and other formats. This flexibility ensures that StatPecker’s visuals can be utilized across various platforms, enhancing the reach and impact of the information presented.
TrafficClaw
AI Chat Analyst
This is the heart of TrafficClaw. Move beyond static reports and interact with your data using natural language. Ask complex questions like "Why did my traffic drop last Tuesday?" or "What are my top underperforming pages?" The AI analyst scours your connected GA4 and Search Console data to deliver instant, evidence-based verdicts and actionable recommendations, complete with supporting charts and insights, all within a conversational chat interface.
SEO Intelligence Suite
Proactively manage your search presence with a suite of automated SEO tools. TrafficClaw continuously monitors for critical issues like keyword gaps where competitors rank but you don't, content decay as older posts lose traction, and keyword cannibalization where your own pages compete against each other. It also includes an AEO (Answer Engine Optimization) engine to help optimize your content for AI-driven search experiences, keeping you ahead of evolving search trends.
Integrated Analytics Dashboard
Consolidate your key metrics into a single, real-time overview. Stop switching tabs between different platforms. This dashboard brings together live visitor counts, traffic trend visualizations, bounce rates, conversion funnel data, and top referrers. It provides a unified, configurable view of your site's health and performance, making it effortless to spot trends and anomalies at a glance.
Live Visitor Globe & Embed
Visualize your global audience in real-time with an interactive 3D globe. This feature plots live visitor activity by country directly on your TrafficClaw dashboard. Uniquely, you can also generate an embed code to showcase this live globe on your own public website, displaying anonymized visitor locations and activity feeds without needing to install any additional tracking scripts.
Use Cases
StatPecker
Content Creation
Writers and content creators can leverage StatPecker to enrich their articles with visually engaging infographics that help convey complex data clearly. This not only enhances reader engagement but also establishes credibility through data-driven storytelling.
Business Reporting
Analysts and business professionals can use StatPecker to transform raw data into insightful visuals for reports and presentations. This feature facilitates clearer communication of trends and performance metrics, enabling data-driven decision-making processes.
Educational Purposes
Educators can utilize StatPecker to create interactive educational materials that simplify complex topics for students. By visualizing data in an engaging manner, teachers can improve comprehension and retention of key concepts.
Marketing Insights
Marketers can harness StatPecker to visualize market trends and consumer behavior effectively. This enables teams to present compelling data to stakeholders, enhancing strategies with insights that drive marketing campaigns and initiatives.
TrafficClaw
Diagnosing Sudden Traffic Drops
When your analytics show an unexpected traffic decline, instead of manually cross-referencing data for hours, you can directly ask the AI analyst "What caused my traffic drop on March 15th?" It will analyze your data, pinpoint the cause—such as a Google core update impacting specific pages, a technical crawl error, or a drop in ranking for a key keyword—and provide a step-by-step fix.
Uncovering Content Optimization Opportunities
Discover which pieces of your existing content have the most potential for improvement. Ask the AI to "find blog posts with declining traffic but high historical authority." It will identify candidates for content refresh, suggest new keyword targets from its gap analysis, and can even help generate updated copy or optimal internal linking structures to revive their performance.
Monitoring Site Health Proactively
Use TrafficClaw as an early warning system. The integrated site audit tool continuously checks page-level performance, Core Web Vitals, and technical SEO factors. You can ask for a summary of critical issues or set up alerts for when health scores dip, allowing you to fix problems like slow page speed or broken links before they significantly impact user experience and rankings.
Demonstrating Real-Time Audience Engagement
For agencies, creators, or businesses wanting to showcase their live reach, the embeddable visitor globe provides a powerful visual tool. Embed it on a landing page, portfolio, or during a live stream to visually demonstrate active, global engagement in real time, adding a layer of social proof and dynamism to your public-facing presence.
Overview
About StatPecker
StatPecker is an innovative AI-powered tool that transforms the way individuals and teams visualize data. Designed for a diverse audience that includes content creators, analysts, marketers, and educators, StatPecker takes raw datasets and converts them into stunning infographics in seconds. This tool alleviates the burden of manual reporting and eliminates the costs associated with hiring professional designers. Its main value proposition lies in its ability to deliver insightful and interactive visuals that enhance understanding and engagement. Whether you are enriching articles, improving business reports, or creating educational content, StatPecker provides quick, credible answers that can be easily shared and published. With features that streamline data storytelling, it empowers users to make informed decisions and effectively communicate insights, making it an essential tool for anyone who works with data.
About TrafficClaw
Ever stared at a sudden traffic dip in your analytics, feeling lost in a sea of graphs that offer no answers? TrafficClaw transforms that confusion into a clear, actionable conversation. It's an AI-powered command center that connects directly to your Google Analytics 4 and Search Console data, allowing you to simply ask questions about your traffic and get intelligent, data-backed verdicts. Instead of piecing together clues from disparate tools, you engage with an AI analyst that examines your real performance, identifies root causes like keyword cannibalization or content decay, and provides specific fixes. Built for website owners, marketers, and developers who crave clarity, TrafficClaw consolidates analytics, SEO intelligence, site audits, and content tools into one intuitive interface. The core promise is profound yet simple: stop guessing why your traffic changes and start having a dialogue that drives measurable growth, all powered by your own data.
Frequently Asked Questions
StatPecker FAQ
How does StatPecker ensure data privacy?
StatPecker processes data locally on your device, which means your information remains private and secure during analysis. This feature is particularly beneficial for users concerned about data confidentiality.
Can I use StatPecker for free?
Yes, StatPecker offers a free tier that allows users to create unlimited projects, embed visuals, and conduct a limited number of AI queries and CSV uploads. This is a great way to explore the tool’s capabilities without any initial investment.
What types of files can I upload?
Users can upload CSV files of up to 50 MB to analyze their data. This allows for a wide range of data inquiries, making it easier to derive insights from various datasets.
Is StatPecker suitable for beginners?
Absolutely! StatPecker is designed with user-friendliness in mind. Its intuitive interface and straightforward features make it accessible for individuals at all skill levels, from beginners to expert analysts.
TrafficClaw FAQ
How does TrafficClaw access my data?
TrafficClaw uses secure, read-only Google OAuth to connect to your Google Analytics 4 and Search Console accounts. This means we never see your password, and our access is limited to viewing your analytics data only. Your data remains in your Google account and is not sold or used to train public AI models.
What kind of questions can I ask the AI Analyst?
You can ask virtually any question about your website's performance and SEO. This includes diagnostic questions ("Why did my conversions drop?"), exploratory queries ("What are my top keyword opportunities this month?"), comparative analysis ("How does my mobile traffic compare to desktop?"), and requests for specific actions ("Generate meta descriptions for my top 5 pages.").
Is there a setup or configuration required?
Setup is designed to be virtually instant. After signing in with Google, TrafficClaw auto-detects your connected GA4 properties and Search Console sites. Your dashboard and AI chat are populated with insights immediately, requiring no manual configuration, tag installation, or complex settings to start getting answers.
Can I use the live globe on any website?
Yes, the interactive visitor globe can be embedded on any website or CMS that supports iframes, such as WordPress, Webflow, or a custom-coded site. You simply copy the provided iframe code snippet and paste it into your site's HTML. It pulls real-time data from your connected GA4 property without requiring any additional tracking code on your site.
Alternatives
StatPecker Alternatives
StatPecker is an innovative AI-powered tool designed to transform company data into quick insights and visually stunning infographics. It falls under the category of analytics and data visualization, catering to a diverse audience that includes content creators, analysts, marketers, and educators. Users often seek alternatives to StatPecker for various reasons, such as pricing concerns, specific feature requirements, or compatibility with different platforms. When exploring alternatives, it’s essential to consider factors like ease of use, the quality of visuals produced, integration capabilities, and the overall cost-effectiveness of the solution. When choosing an alternative, prioritize tools that not only meet your immediate data visualization needs but also offer scalability for future growth. Look for user-friendly interfaces that allow for seamless interaction and efficient data analysis, as well as robust sharing and embedding options to enhance your content's reach. Ultimately, the right alternative should empower you to communicate your data-driven insights effectively without getting bogged down in the complexities of manual reporting or design.
TrafficClaw Alternatives
TrafficClaw is an AI assistant for SEO and analytics, designed to let you ask direct questions about your traffic and get actionable answers from your connected data sources like GA4 and Search Console. It belongs to the growing category of conversational analytics tools that aim to simplify complex data interpretation. Users often explore alternatives for various reasons, such as budget constraints, the need for different feature sets, or compatibility with other platforms in their tech stack. Some may seek tools with broader integrations, more advanced reporting, or a different approach to data visualization. When evaluating other options, consider the core ability to translate raw data into clear insights. Look for robust data source connections, the intelligence of the analysis provided, and how seamlessly the tool fits into your existing workflow. The goal is to move from static graphs to dynamic, understandable guidance for your website's performance.