Skippership vs StatPecker
Side-by-side comparison to help you choose the right AI tool.
Skippership
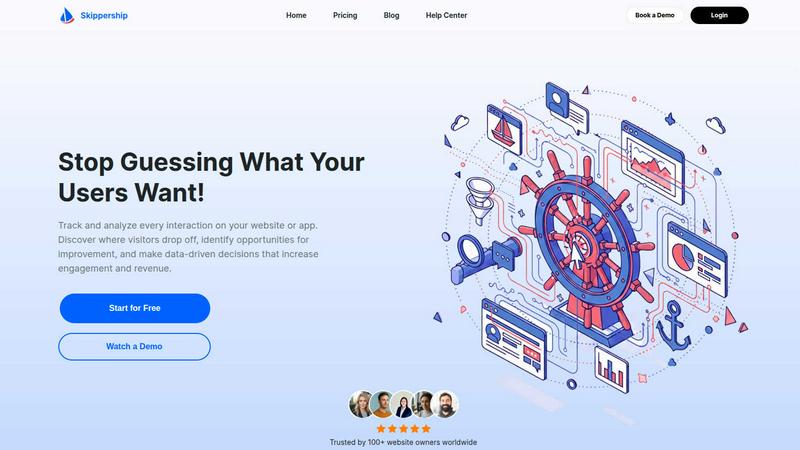
Unlock user behavior insights with Skippership to enhance engagement and drive conversions effortlessly.
Last updated: March 1, 2026

StatPecker
StatPecker turns your company data into quick insights and stunning visuals, empowering better decisions and.
Last updated: March 1, 2026
Visual Comparison
Skippership
StatPecker

Feature Comparison
Skippership
Session Replays
Skippership allows you to watch real user sessions unfold, providing an unfiltered view of how users navigate your site. This feature helps uncover friction points, usability issues, and conversion blockers, enabling you to make informed, data-driven decisions to enhance user experiences.
Heatmaps
With Skippership’s heatmaps, you gain a visual representation of user interactions on your pages. This feature reveals where users click, scroll, and invest their time, helping you identify overlooked areas that can be optimized to boost engagement and ultimately increase conversions.
Goal Tracking
Easily track key actions such as signups, purchases, and clicks with Skippership's goal tracking feature. This functionality allows you to measure performance and uncover patterns in user behavior, giving you real-time insights into what drives conversions and fostering a data-driven approach to decision-making.
AI Analytics
Harness the power of AI with Skippership's analytics tools that automatically identify patterns in user behavior. This feature speeds up the decision-making process, allowing you to understand user motivations quickly, boost engagement, and strengthen retention through informed strategies.
StatPecker
Ask Your Query
With StatPecker’s intuitive interface, users can ask questions and receive instant insights from validated sources. This feature eliminates the need for complex tools and allows users to focus on their data stories rather than the intricacies of data analysis.
Publish & Embed
StatPecker makes it easy to create interactive visuals that can be seamlessly integrated into blogs, articles, and websites. This feature ensures that users can share their insights effectively, enhancing content with visually appealing graphics that captivate audiences.
Upload & Analyze CSVs
This feature allows users to upload local CSV files and extract key insights without the hassle of traditional spreadsheets. Users can analyze their data securely on their devices, making it a private and efficient way to derive meaningful conclusions from their datasets.
Download & Use Anywhere
Users can export their infographics as images, making it simple to include them in reports, presentations, and other formats. This flexibility ensures that StatPecker’s visuals can be utilized across various platforms, enhancing the reach and impact of the information presented.
Use Cases
Skippership
Enhancing User Experience
Marketers and UX designers can utilize Skippership to analyze user journeys and identify pain points. By understanding where users struggle, teams can optimize their designs and content, ultimately leading to improved user satisfaction and retention.
Boosting Conversion Rates
Product managers can leverage Skippership to track key performance indicators and user interactions. By identifying what actions lead to conversions, teams can adjust their strategies to capitalize on successful behaviors, significantly enhancing conversion rates.
A/B Testing Support
Skippership provides valuable insights for A/B testing by allowing you to see how different variations perform in real-time. This capability aids teams in making data-driven decisions about what changes resonate best with users, refining their approaches for better outcomes.
Identifying Content Gaps
Content creators can use Skippership to analyze heatmaps and session replays to discover which content resonates and which is ignored. By identifying content gaps, teams can tailor their offerings to better meet the needs and interests of their audience, driving engagement.
StatPecker
Content Creation
Writers and content creators can leverage StatPecker to enrich their articles with visually engaging infographics that help convey complex data clearly. This not only enhances reader engagement but also establishes credibility through data-driven storytelling.
Business Reporting
Analysts and business professionals can use StatPecker to transform raw data into insightful visuals for reports and presentations. This feature facilitates clearer communication of trends and performance metrics, enabling data-driven decision-making processes.
Educational Purposes
Educators can utilize StatPecker to create interactive educational materials that simplify complex topics for students. By visualizing data in an engaging manner, teachers can improve comprehension and retention of key concepts.
Marketing Insights
Marketers can harness StatPecker to visualize market trends and consumer behavior effectively. This enables teams to present compelling data to stakeholders, enhancing strategies with insights that drive marketing campaigns and initiatives.
Overview
About Skippership
Skippership is an innovative analytics platform that revolutionizes how website and app owners understand user behavior at a granular level. By leveraging the power of artificial intelligence, Skippership provides a comprehensive suite of tools that track and analyze every interaction on digital properties. This capability enables users to pinpoint where visitors drop off, uncover usability issues, and identify opportunities for improvement. Ideal for marketers, UX designers, and product managers, Skippership transforms complex user data into actionable insights, empowering businesses to make informed decisions that enhance user experiences and boost conversion rates. With features like session recordings, interactive heatmaps, and goal tracking, Skippership offers a single, intuitive dashboard that removes the guesswork from understanding visitor needs. The platform's primary value proposition lies in its ability to turn intricate behavioral data into clear, actionable insights that drive engagement and increase revenue.
About StatPecker
StatPecker is an innovative AI-powered tool that transforms the way individuals and teams visualize data. Designed for a diverse audience that includes content creators, analysts, marketers, and educators, StatPecker takes raw datasets and converts them into stunning infographics in seconds. This tool alleviates the burden of manual reporting and eliminates the costs associated with hiring professional designers. Its main value proposition lies in its ability to deliver insightful and interactive visuals that enhance understanding and engagement. Whether you are enriching articles, improving business reports, or creating educational content, StatPecker provides quick, credible answers that can be easily shared and published. With features that streamline data storytelling, it empowers users to make informed decisions and effectively communicate insights, making it an essential tool for anyone who works with data.
Frequently Asked Questions
Skippership FAQ
How does Skippership ensure user data privacy?
Skippership prioritizes user privacy by processing only the necessary data, in compliance with GDPR and CCPA standards. All data is secured with SSL/TLS encryption, ensuring that sensitive information remains protected throughout its lifecycle.
Can Skippership integrate with other platforms?
Yes, Skippership can seamlessly integrate with over 50 platforms, including Google Analytics, WordPress, Shopify, and more. This feature allows users to unify their tech stack and streamline their workflows, enhancing overall efficiency.
What types of businesses can benefit from Skippership?
Skippership is designed for a wide range of users, including marketers, UX designers, product managers, and business owners. Any organization seeking to improve user experiences, boost conversions, and make data-driven decisions can benefit from its insights.
Is there a free trial available for Skippership?
Yes, Skippership offers users the opportunity to start for free. This allows potential customers to explore the platform's features and capabilities without commitment, providing a risk-free way to evaluate its fit for their needs.
StatPecker FAQ
How does StatPecker ensure data privacy?
StatPecker processes data locally on your device, which means your information remains private and secure during analysis. This feature is particularly beneficial for users concerned about data confidentiality.
Can I use StatPecker for free?
Yes, StatPecker offers a free tier that allows users to create unlimited projects, embed visuals, and conduct a limited number of AI queries and CSV uploads. This is a great way to explore the tool’s capabilities without any initial investment.
What types of files can I upload?
Users can upload CSV files of up to 50 MB to analyze their data. This allows for a wide range of data inquiries, making it easier to derive insights from various datasets.
Is StatPecker suitable for beginners?
Absolutely! StatPecker is designed with user-friendliness in mind. Its intuitive interface and straightforward features make it accessible for individuals at all skill levels, from beginners to expert analysts.
Alternatives
Skippership Alternatives
Skippership is an advanced analytics platform that provides deep insights into user behavior for websites and apps. By leveraging AI-powered tools, it helps businesses understand how visitors interact with their digital properties, aiming to enhance engagement and drive conversions. As marketers, UX designers, and product managers seek to optimize user experiences, they often explore alternatives due to factors such as pricing, specific feature sets, or compatibility with their existing platforms. When considering alternatives, users should prioritize features that align with their unique needs, such as session replays, heatmaps, and goal tracking. Additionally, ease of use, integration capabilities, and customer support are crucial elements that can influence the decision-making process. A thorough evaluation of available options can lead to the best fit for enhancing user engagement and achieving business goals.
StatPecker Alternatives
StatPecker is an innovative AI-powered tool designed to transform company data into quick insights and visually stunning infographics. It falls under the category of analytics and data visualization, catering to a diverse audience that includes content creators, analysts, marketers, and educators. Users often seek alternatives to StatPecker for various reasons, such as pricing concerns, specific feature requirements, or compatibility with different platforms. When exploring alternatives, it’s essential to consider factors like ease of use, the quality of visuals produced, integration capabilities, and the overall cost-effectiveness of the solution. When choosing an alternative, prioritize tools that not only meet your immediate data visualization needs but also offer scalability for future growth. Look for user-friendly interfaces that allow for seamless interaction and efficient data analysis, as well as robust sharing and embedding options to enhance your content's reach. Ultimately, the right alternative should empower you to communicate your data-driven insights effectively without getting bogged down in the complexities of manual reporting or design.