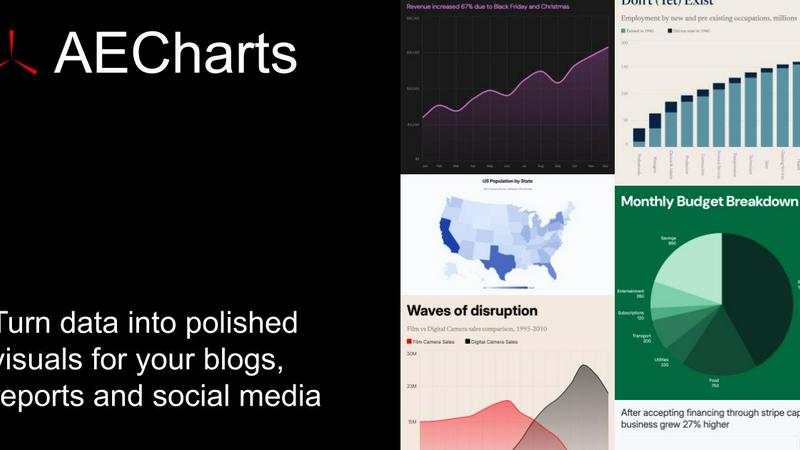
AECharts
Discover how AECharts instantly transforms your data into animated videos for compelling presentations and reports.
About AECharts
What if you could transform your raw spreadsheet data into a captivating, animated story in just a few clicks? AECharts is a browser-based animated chart maker designed to do exactly that, eliminating the traditional barriers of complex software, steep learning curves, and expensive design resources. It serves a simple yet powerful purpose: to turn numbers into engaging video narratives. This tool is built for anyone who needs to communicate data with clarity and impact, from marketers crafting social media reels and journalists illustrating trends to researchers presenting findings and founders pitching to investors. The core value proposition is profound accessibility. You don't need any video editing experience, design skills, or to install software. By simply uploading a spreadsheet, pasting data, or connecting a Google Sheet, you can explore a world of animated charts. Choose from over 14 types, including bar chart races, line charts, and pie charts, and watch as AECharts assembles a polished, animated video in minutes. Every element is customizable, allowing you to infuse your brand's identity through colors, fonts, and logos. The final result is a versatile MP4 video ready to boost engagement on YouTube, LinkedIn, presentations, or newsletters, making powerful data visualization as straightforward as taking a screenshot.
Features of AECharts
Browser-Based, No-Install Platform
Dive right into creation without any technical hurdles. AECharts runs entirely in your web browser, meaning there's no software to download, install, or update. This immediate access allows you to start exploring and building your animated charts from any computer, at any time. It removes the friction of traditional video editing suites, making professional-grade data animation an on-demand resource rather than a complex project.
Extensive Chart Library & Templates
Uncover the perfect visual for your story with a growing library of over 14 chart types. Go beyond standard bar and line charts to explore dynamic formats like bar chart races, waffle charts, treemaps, and animated numbers. Each chart type comes with a selection of pre-built, professional templates that provide a stunning starting point. These templates are fully customizable, letting you experiment with different visual styles until you find the one that makes your data sing.
Integrated Brand Kit Automation
Imagine applying your company's visual identity to every chart automatically. AECharts' Brand Kit feature allows you to set your primary colors, fonts, and logo once. Then, with a single click, every new chart you create inherits these brand elements, ensuring consistent, on-brand visuals across all your reports, presentations, and social media content. This transforms chart creation from a manual design task into a streamlined, scalable process.
Flexible Multi-Format Export
Your animated creation shouldn't be locked into a single format. AECharts provides flexible export options to fit any platform. Need a video for social media? Export an MP4. Require a still image for a report or slide deck? Download a high-resolution PNG or JPEG. The tool even offers preset aspect ratios like 16:9 for presentations, 1:1 for Instagram, and 4:5 for Reels, giving you the perfect asset for every channel without extra editing.
Use Cases of AECharts
Social Media Content & Reels
Curious how to stop the scroll on crowded social feeds? Marketers and content creators use AECharts to transform dry metrics into eye-catching animated videos for platforms like LinkedIn, Instagram Reels, and TikTok. A bar chart race showing subscriber growth or an animated line chart illustrating sales trends can dramatically increase engagement, comments, and shares compared to static images, making data-driven storytelling a key part of social strategy.
Dynamic Business & Pitch Presentations
Founders, sales teams, and executives can elevate their presentations by embedding animated charts directly into PowerPoint or Google Slides. Instead of pointing to a stagnant graph, you can play a short video that builds the narrative step-by-step, highlighting key increases, decreases, or comparisons. This dynamic approach holds audience attention, makes complex data understandable, and adds a layer of professional polish to investor pitches and quarterly reviews.
Data Journalism & Editorial Content
Journalists and bloggers face the challenge of making statistics relatable and memorable for their readers. AECharts allows them to quickly create embeddable or shareable animated charts that illustrate trends in politics, economics, or social issues. An animated chart showing election poll changes over time or pandemic case fluctuations tells a more compelling and digestible story than a table of numbers, enhancing article depth and reader comprehension.
Internal Reporting & Team Updates
Managers and project leads can revolutionize boring spreadsheet updates. By converting weekly KPIs, project timelines, or performance metrics into a short, animated summary video, they can communicate progress more effectively in team meetings or email newsletters. This visual approach helps teams quickly grasp status, celebrate milestones, and identify areas needing attention, fostering a more data-literate and engaged workplace culture.
Frequently Asked Questions
What is AECharts?
AECharts is a specialized online tool designed to create animated chart videos directly from your data. It bridges the gap between simple spreadsheet charts and complex video animation software, allowing users to produce professional, engaging data visualizations as videos (MP4) or images without any prior design or editing expertise. It's a focused solution for turning numerical data into dynamic visual stories.
Do I need coding or design skills to use it?
Absolutely not. AECharts is built specifically for users with zero coding or professional design experience. The interface is intuitive and guide-driven: you pick a chart type, input your data via paste or upload, and use simple sidebar controls to customize the visuals. The platform handles all the complex animation and rendering in the background, making sophisticated outputs accessible to everyone.
Can I import data from CSV or spreadsheets?
Yes, data import is a core strength. You can seamlessly bring your existing data into AECharts by pasting it directly from Excel or Google Sheets, uploading a CSV file, or even connecting a live Google Sheet for dynamic updates. This flexibility means you don't have to manually re-enter data, allowing you to work directly with the datasets you already use and trust in your daily workflow.
What export formats are available?
AECharts supports multiple export formats to suit various needs. For video purposes, you can export your creation as an MP4 file. For static use cases, such as including in printed reports, websites, or slides, you can download high-quality PNG or JPEG images. This multi-format support ensures you have the right asset for any platform, from YouTube videos to PowerPoint slides.
Similar to AECharts
Easymotion - AI Motion Graphic Generator
AI motion graphics and map animation generator for content creators, editors, founders and marketers.
Receiptum
Receiptum allows you to effortlessly create fully customizable, professional receipts in seconds, no design skills required.
Sprite-AI
Describe your dream pixel sprite and watch Sprite-AI bring it to life in seconds, no drawing required.
ImageGen2
Discover how ImageGen2 unlocks OpenAI's GPT Image 2 model for free, delivering photorealistic images with flawless text rendering and intelligent.
dmaya
dMaya is an AI design platform that streamlines UI creation, client collaboration, and code export for teams and agencies.
Fashion Diffusion
The all-in-one AI fashion design platform built to power the next generation of professional apparel creation and e-commerce efficiency.
Ninjasell
NinjaSell automates your Etsy print-on-demand business by creating optimized listings, mockups, and white-label shipping, so you can scale.