Dividend Data vs Redbark
Side-by-side comparison to help you choose the right AI tool.
Dividend Data
Unlock decades of stock data directly in your spreadsheet with a simple formula.
Last updated: March 11, 2026
Effortlessly sync your Australian bank and brokerage data to Google Sheets, YNAB, and more with real-time updates.
Last updated: March 4, 2026
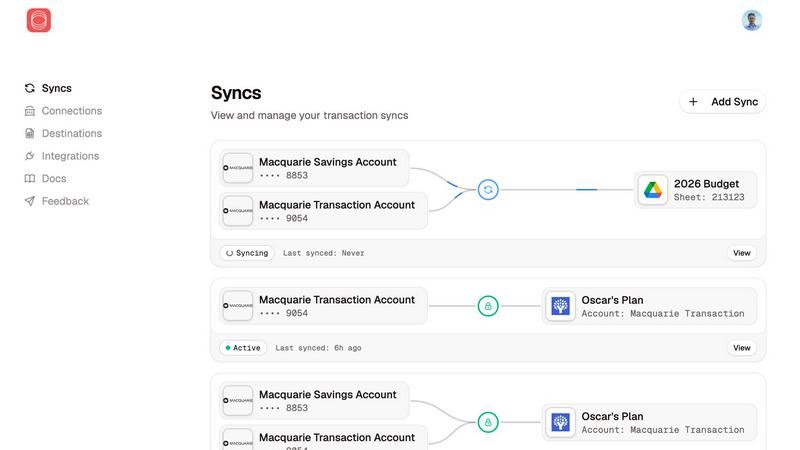
Visual Comparison
Dividend Data

Redbark
Feature Comparison
Dividend Data
Comprehensive Spreadsheet Functions
Dive deep into your analysis with 16 purpose-built custom functions that cover every essential aspect for a dividend and fundamental investor. From DIVIDENDDATA_DIVIDENDS to fetch forward yield and ex-dividend dates, to DIVIDENDDATA_RATIOS for PE Ratios and DIVIDENDDATA_METRICS for diluted EPS, these formulas act as your direct conduit to live data. Simply type them into any cell to instantly pull and refresh information, turning a static spreadsheet into a live, connected financial dashboard without any coding required.
Vast Historical & Real-Time Data Library
Satisfy your curiosity with an expansive database featuring 30+ years of historical market data across 80,000+ global tickers. This feature allows you to backtest investment theories, analyze long-term dividend growth trends, and examine financial ratios over full market cycles. Whether you're investigating a company's payout consistency through recessions or its earnings trajectory, you have decades of context at your fingertips, all accessible within seconds directly in your spreadsheet.
Dual-Platform Compatibility
Explore and analyze without constraints, as Dividend Data seamlessly integrates with both Google Sheets and Microsoft Excel. This flexibility means you can collaborate on a cloud-based Sheets document with a team or conduct deep, complex modeling in your desktop Excel application, all while using the same familiar formulas and accessing the identical, robust dataset. It ensures your workflow remains uninterrupted, regardless of your preferred spreadsheet environment.
Free Tier with Generous Monthly Credits
Begin your data exploration journey immediately with a free tier that provides 2,500 credits every month, with no trial period expiration. This allows you to thoroughly test the platform's capabilities, run numerous queries, and integrate data into your models without any upfront financial commitment. It’s an open invitation to experiment and discover how automated data can enhance your investment research process.
Redbark
Seamless Bank Connections
Redbark allows you to connect your Australian bank accounts effortlessly, ensuring that your transactions sync directly to your preferred tools like Google Sheets and Notion. This eliminates the hassle of manual exports or CSV wrangling, providing real-time updates and complete privacy.
Multi-Destination Support
With Redbark, you can sync the same bank accounts to multiple destinations simultaneously. Whether you want to track your spending in Google Sheets, budget in YNAB, or manage your finances in Actual Budget, each destination can have its own custom formatting, making financial management more streamlined.
Automated Background Sync
Say goodbye to the headaches of manual data updates. Redbark uses webhooks to trigger automatic background syncs whenever new financial data is available, ensuring that your tools are always up to date with the latest transactions and balances without any extra effort on your part.
Enhanced Security Measures
Redbark prioritizes your security with a robust architecture that never stores sensitive transactions or account details. Utilizing AES-256 encryption and adhering to CDR compliance, your financial data remains secure and under Australian jurisdiction, providing peace of mind with every sync.
Use Cases
Dividend Data
Building a Dividend Growth Screener
Curious about which companies have not only paid but consistently grown their dividends? You can build a powerful screening model directly in your spreadsheet. Use functions to pull dividend growth rates, payout ratios, and yield history for thousands of stocks. Automate the process to filter and rank companies that meet your specific criteria for sustainable dividend growth, creating a dynamic watchlist that updates with fresh data.
Conducting Deep Fundamental Analysis
When you're researching a potential investment, you need more than just a price quote. Use Dividend Data to pull complete financial statements, calculate key valuation and profitability ratios, and assess debt levels. Create a comprehensive analysis sheet for any ticker, linking cells to live data for revenue, earnings, book value, and cash flow, enabling a thorough, up-to-date fundamental review without leaving your spreadsheet.
Automated Portfolio Monitoring and Reporting
Imagine having a portfolio tracker that updates itself. By linking your holdings to Dividend Data's functions, you can automatically pull current prices, dividend announcements, and yield-on-cost for each position. Aggregate this data to see your portfolio's total income, overall valuation changes, and sector exposure in real-time, transforming a simple list of stocks into a dynamic performance dashboard.
Historical Backtesting of Investment Strategies
What would a strategy based on low PE ratios and high dividend yields have returned over the past 20 years? With access to 30+ years of historical data, you can backtest quantitative strategies directly in Excel or Sheets. Pull historical prices, dividends, and financial metrics for relevant periods to model returns and risk, allowing you to explore the historical efficacy of your investment hypotheses with concrete data.
Redbark
Freelancers Managing Invoices
Freelancers can streamline their invoicing processes by automatically syncing their bank transactions to Google Sheets or Notion. This allows for easy tracking of payments received and outstanding invoices, making financial management less tedious.
Investors Monitoring Portfolios
Investors can effortlessly connect their brokerage accounts to Redbark, providing real-time updates on their investment holdings and transactions. This enables them to make informed decisions based on their current financial status without manual updates.
Small Business Owners Overseeing Cash Flow
Small business owners can benefit from Redbark by managing their cash flow effectively. By syncing transactions directly to budgeting tools like YNAB or Actual Budget, they gain a clear view of their financial health, helping them make strategic decisions.
Individuals Desiring Automated Financial Insights
Anyone looking to gain clarity on their financial situation can use Redbark to automate their financial tracking. By connecting multiple accounts and syncing them to their preferred tools, users can achieve a comprehensive overview of their finances with minimal effort.
Overview
About Dividend Data
What if you could transform your familiar spreadsheet into a dynamic, real-time research terminal? Dividend Data does exactly that, unlocking a world of institutional-grade financial data with the simplicity of a custom formula. Built by a dividend investor for like-minded analysts, this powerful tool brings over 30 years of historical and current market data for more than 80,000 tickers directly into your Google Sheets or Microsoft Excel workspace. Imagine no longer needing to manually copy-paste figures, hunt for API keys, or write a single line of code. The core magic lies in its custom functions; you simply type a formula like =DIVIDENDDATA_DIVIDENDS("MSFT") and watch as live data on dividends, yields, and payout ratios instantly populates your cell. It’s designed for the fundamental investor who craves depth—offering access to dividends, financial statements, earnings, key ratios, price history, and over 100 other metrics—but without the intimidating complexity or cost typically associated with professional data feeds. With a generous free tier offering 2,500 monthly credits that never expire, Dividend Data invites you to start exploring the markets with a curious, data-driven mindset right from your most trusted analytical environment.
About Redbark
Redbark serves as a secure and efficient bridge for managing your financial data, seamlessly connecting your Australian bank accounts and global investment portfolios to the productivity tools you already rely on, such as Google Sheets, Notion, and Airtable. Designed to eliminate the repetitive and error-prone task of manual data entry, Redbark provides a modern solution that bypasses outdated screen-scraping techniques. By leveraging Australia's official Consumer Data Right (CDR) framework, Redbark ensures bank-approved access to your transaction histories, balances, and investment holdings, all while maintaining a strong emphasis on security and privacy. This innovative tool is ideal for freelancers managing invoices, investors tracking their portfolios, small business owners overseeing cash flow, and anyone desiring a comprehensive and automated view of their finances. With a rapid setup process that requires no coding skills, Redbark supports a diverse array of Australian banks, New Zealand banks via Akahu, and global brokerages through SnapTrade, making it a versatile choice for financial management.
Frequently Asked Questions
Dividend Data FAQ
How do I get started with Dividend Data?
Getting started is a simple exploration. For Google Sheets, install the add-on from the Google Workspace Marketplace. For Microsoft Excel, get the add-in from Microsoft AppSource. Once installed, you can immediately start using the custom functions like =DIVIDENDDATA_QUOTE("AAPL", "price") in your spreadsheets. No API key configuration is needed, and your free monthly credits are available right away.
What is included in the free tier?
The free tier is designed for curious investors to begin their discovery. It includes 2,500 credits per month, which never expire, allowing you to make a substantial number of data queries. You get full access to all 16 custom functions and the vast database of historical and current data, enabling significant analysis without any cost. It's a fully-featured introduction to the platform's capabilities.
What kind of data can I access?
Your curiosity can span a wide range of financial data. You have instant access to dividend-specific information (amounts, yields, dates, growth), real-time quotes, over 30 years of price history, complete financial statements (income, balance sheet, cash flow), and key fundamental ratios (P/E, P/B, Debt/Equity). In total, you can explore over 100 different metrics for more than 80,000 global stocks and ETFs.
Does the data update automatically in my spreadsheet?
Yes, the data is designed to be live and refreshable. When you open a spreadsheet containing Dividend Data formulas, the cells will typically update to show the most current information available. You can also manually recalculate or refresh the sheet to pull the latest data, ensuring your analysis always reflects the current market conditions and company fundamentals.
Redbark FAQ
How does Redbark ensure my financial data is secure?
Redbark employs a pass-through architecture, meaning your financial data flows directly from your bank to your chosen destination without being stored on Redbark's servers. Additionally, all data is encrypted using AES-256 encryption, and Redbark adheres to CDR compliance, ensuring your data remains secure and private.
What types of accounts can I connect to Redbark?
You can connect a wide range of Australian bank accounts, including everyday accounts, savings accounts, and credit cards. Additionally, Redbark supports global brokerages and crypto exchanges through SnapTrade, allowing for comprehensive financial tracking.
How quickly does Redbark sync my financial data?
Redbark offers real-time updates with automated background syncs. Whenever new financial data is available, webhooks trigger a sync, meaning your tools will reflect the latest transactions and balances almost instantly, often within minutes.
Is there any coding required to set up Redbark?
No coding skills are necessary to set up Redbark. The process is designed to be user-friendly, allowing you to connect your accounts and choose your desired destinations in just minutes, making it accessible for everyone regardless of technical expertise.
Alternatives
Dividend Data Alternatives
Dividend Data is a specialized tool that brings decades of stock market and dividend information directly into your spreadsheet. It falls into the category of financial data platforms designed for self-directed, fundamental investors who prioritize ease of use and deep historical analysis. Users often explore other options to find a solution that perfectly aligns with their budget, the specific metrics they track, or whether they primarily use Excel versus Google Sheets. The search for an alternative is a natural part of the discovery process. You might be evaluating different pricing models, seeking a particular dataset not currently offered, or require integration with other software in your investment workflow. It's a smart way to ensure the tool you choose is the best fit for your unique strategy and technical environment. When comparing options, focus on the core elements that matter most to your research. Consider the depth and reliability of the historical data, the simplicity of accessing it within your preferred spreadsheet platform, and the total cost relative to your usage. The ideal alternative will feel like a seamless extension of your investment process, providing trustworthy data without complexity.
Redbark Alternatives
Redbark is a seamless solution designed to sync your Australian bank and brokerage data automatically with popular productivity tools like Google Sheets and Notion. It belongs to the Business & Finance category, offering a secure and efficient way to manage financial information without the hassle of manual data entry. Users often seek alternatives to Redbark for various reasons, such as differing pricing structures, specific feature requirements, or compatibility with other platforms. When choosing an alternative, it's essential to consider factors like security, user-friendliness, integration capabilities with existing tools, and the specific financial data you need to manage. Understanding these elements can help you find a solution that meets your needs while ensuring a smooth and secure experience.