Dividend Data vs incentX
Side-by-side comparison to help you choose the right AI tool.
Dividend Data
Unlock decades of stock data directly in your spreadsheet with a simple formula.
Last updated: March 11, 2026
Discover how incentX ensures precise payouts by automating incentives from transaction-level data.
Last updated: February 28, 2026
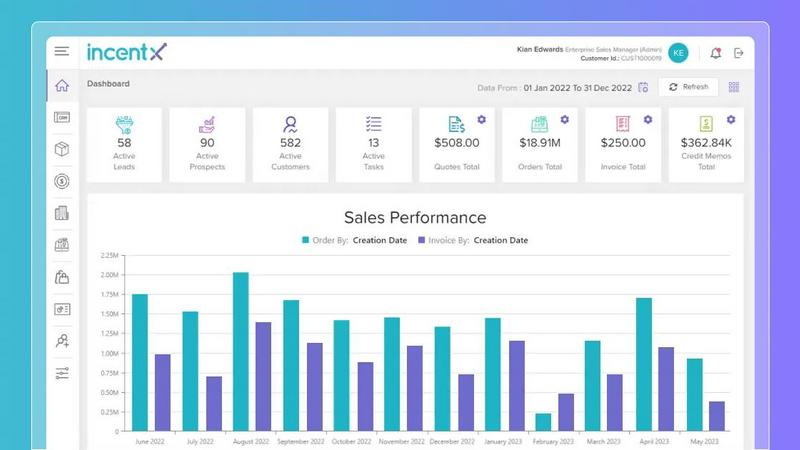
Visual Comparison
Dividend Data

incentX
Feature Comparison
Dividend Data
Comprehensive Spreadsheet Functions
Dive deep into your analysis with 16 purpose-built custom functions that cover every essential aspect for a dividend and fundamental investor. From DIVIDENDDATA_DIVIDENDS to fetch forward yield and ex-dividend dates, to DIVIDENDDATA_RATIOS for PE Ratios and DIVIDENDDATA_METRICS for diluted EPS, these formulas act as your direct conduit to live data. Simply type them into any cell to instantly pull and refresh information, turning a static spreadsheet into a live, connected financial dashboard without any coding required.
Vast Historical & Real-Time Data Library
Satisfy your curiosity with an expansive database featuring 30+ years of historical market data across 80,000+ global tickers. This feature allows you to backtest investment theories, analyze long-term dividend growth trends, and examine financial ratios over full market cycles. Whether you're investigating a company's payout consistency through recessions or its earnings trajectory, you have decades of context at your fingertips, all accessible within seconds directly in your spreadsheet.
Dual-Platform Compatibility
Explore and analyze without constraints, as Dividend Data seamlessly integrates with both Google Sheets and Microsoft Excel. This flexibility means you can collaborate on a cloud-based Sheets document with a team or conduct deep, complex modeling in your desktop Excel application, all while using the same familiar formulas and accessing the identical, robust dataset. It ensures your workflow remains uninterrupted, regardless of your preferred spreadsheet environment.
Free Tier with Generous Monthly Credits
Begin your data exploration journey immediately with a free tier that provides 2,500 credits every month, with no trial period expiration. This allows you to thoroughly test the platform's capabilities, run numerous queries, and integrate data into your models without any upfront financial commitment. It’s an open invitation to experiment and discover how automated data can enhance your investment research process.
incentX
Transaction-Level Forecasting
Ever wondered how to predict commission costs with absolute certainty? incentX's forecasting ties directly to fulfilled transactions from your ERP, not to speculative sales forecasts. This means you can explore future payouts with unmatched accuracy, forecasting by product, team, or region based on actual margin and fulfillment data. It eliminates costly overpayments and reduces the need for manual, retroactive adjustments, giving finance teams a clear and reliable view of upcoming liabilities.
Automated Incentive Calculation
What does it look like when incentive calculations run themselves? incentX automates the entire process by applying your custom rules directly to transaction data. This eliminates manual errors and the administrative burden of spreadsheet management. You can set up complex filters to calculate payouts based on product, region, margin tier, or representative, ensuring every dollar paid is precisely earned according to your defined business logic.
Real-Time Performance Visibility
How can you keep a pulse on incentive performance as it happens? incentX provides a live dashboard where revenue and operations leaders can monitor incentives in real-time. This transparency allows for informed, agile decision-making and better sales alignment. Representatives gain clear visibility into the transactions behind their earnings, which dramatically reduces disputes and builds trust in the compensation process.
Unified Platform for All Incentives
Why manage different incentive types with separate, siloed tools? incentX is built as a complete suite, handling both sales-side and buy-side programs from a single platform. Explore managing sales commissions, partner rebates, royalties, and trade promotions all driven by the same foundational transaction data. This holistic approach ensures consistency, reduces IT complexity, and provides a comprehensive view of your entire incentive expenditure.
Use Cases
Dividend Data
Building a Dividend Growth Screener
Curious about which companies have not only paid but consistently grown their dividends? You can build a powerful screening model directly in your spreadsheet. Use functions to pull dividend growth rates, payout ratios, and yield history for thousands of stocks. Automate the process to filter and rank companies that meet your specific criteria for sustainable dividend growth, creating a dynamic watchlist that updates with fresh data.
Conducting Deep Fundamental Analysis
When you're researching a potential investment, you need more than just a price quote. Use Dividend Data to pull complete financial statements, calculate key valuation and profitability ratios, and assess debt levels. Create a comprehensive analysis sheet for any ticker, linking cells to live data for revenue, earnings, book value, and cash flow, enabling a thorough, up-to-date fundamental review without leaving your spreadsheet.
Automated Portfolio Monitoring and Reporting
Imagine having a portfolio tracker that updates itself. By linking your holdings to Dividend Data's functions, you can automatically pull current prices, dividend announcements, and yield-on-cost for each position. Aggregate this data to see your portfolio's total income, overall valuation changes, and sector exposure in real-time, transforming a simple list of stocks into a dynamic performance dashboard.
Historical Backtesting of Investment Strategies
What would a strategy based on low PE ratios and high dividend yields have returned over the past 20 years? With access to 30+ years of historical data, you can backtest quantitative strategies directly in Excel or Sheets. Pull historical prices, dividends, and financial metrics for relevant periods to model returns and risk, allowing you to explore the historical efficacy of your investment hypotheses with concrete data.
incentX
Streamlining Complex Sales Commissions
For organizations with multi-tiered, margin-based, or product-specific commission plans, incentX transforms a chaotic process. It automatically calculates payouts by connecting commission rules directly to closed deals and fulfilled orders in the ERP. Sales reps can explore their earnings in detail, seeing the exact transactions that contributed, which fosters motivation and eliminates time-consuming payout disputes for the finance team.
Automating Partner Rebate Programs
Managing rebates with partners often involves shadow accounting and delayed claims. incentX streamlines this by using real-time order and shipment data to automatically calculate rebate accruals and payouts. Partners gain a portal to track their progress, while your finance team gains an audit-ready trail, maximizing ROI and strengthening partner relationships through transparency and accuracy.
Ensuring Accurate Royalties Management
Calculating royalties based on estimates or periodic sales reports is fraught with error. incentX ensures accuracy by calculating royalties directly from actual sales transaction data. This provides licensors and licensees with a single source of truth, ensuring compliance with agreements and simplifying the audit process. It turns a traditionally contentious process into a smooth, automated workflow.
Resolving Vendor Chargebacks Efficiently
Matching vendor chargebacks and deductions to the correct invoices and return transactions is a manual headache. incentX automates this matching process, providing full invoice-level visibility. This allows AP and procurement teams to quickly validate deductions, resolve disputes faster, and maintain healthier vendor relationships by ensuring every chargeback is justified by actual transactional data.
Overview
About Dividend Data
What if you could transform your familiar spreadsheet into a dynamic, real-time research terminal? Dividend Data does exactly that, unlocking a world of institutional-grade financial data with the simplicity of a custom formula. Built by a dividend investor for like-minded analysts, this powerful tool brings over 30 years of historical and current market data for more than 80,000 tickers directly into your Google Sheets or Microsoft Excel workspace. Imagine no longer needing to manually copy-paste figures, hunt for API keys, or write a single line of code. The core magic lies in its custom functions; you simply type a formula like =DIVIDENDDATA_DIVIDENDS("MSFT") and watch as live data on dividends, yields, and payout ratios instantly populates your cell. It’s designed for the fundamental investor who craves depth—offering access to dividends, financial statements, earnings, key ratios, price history, and over 100 other metrics—but without the intimidating complexity or cost typically associated with professional data feeds. With a generous free tier offering 2,500 monthly credits that never expire, Dividend Data invites you to start exploring the markets with a curious, data-driven mindset right from your most trusted analytical environment.
About incentX
What if you could see the true story behind every incentive payout? incentX is an innovative incentive automation platform that invites you to explore a new way of managing complex compensation. It acts as a unified source of truth, designed to streamline and automate everything from sales commissions and partner rebates to royalties and vendor chargebacks. By connecting directly to your existing CRM and ERP systems, incentX calculates incentives at the granular transaction level, replacing error-prone spreadsheets and disconnected tools with a single, powerful engine. This approach is a game-changer for revenue, finance, and operations teams, offering real-time visibility into performance and ensuring payouts are accurate, transparent, and audit-ready. Whether you're curious about forecasting costs with precision or designing incentive plans that truly drive profitable behavior, incentX empowers organizations of all sizes to align their compensation strategies with how their business actually operates, fostering trust and measurable growth.
Frequently Asked Questions
Dividend Data FAQ
How do I get started with Dividend Data?
Getting started is a simple exploration. For Google Sheets, install the add-on from the Google Workspace Marketplace. For Microsoft Excel, get the add-in from Microsoft AppSource. Once installed, you can immediately start using the custom functions like =DIVIDENDDATA_QUOTE("AAPL", "price") in your spreadsheets. No API key configuration is needed, and your free monthly credits are available right away.
What is included in the free tier?
The free tier is designed for curious investors to begin their discovery. It includes 2,500 credits per month, which never expire, allowing you to make a substantial number of data queries. You get full access to all 16 custom functions and the vast database of historical and current data, enabling significant analysis without any cost. It's a fully-featured introduction to the platform's capabilities.
What kind of data can I access?
Your curiosity can span a wide range of financial data. You have instant access to dividend-specific information (amounts, yields, dates, growth), real-time quotes, over 30 years of price history, complete financial statements (income, balance sheet, cash flow), and key fundamental ratios (P/E, P/B, Debt/Equity). In total, you can explore over 100 different metrics for more than 80,000 global stocks and ETFs.
Does the data update automatically in my spreadsheet?
Yes, the data is designed to be live and refreshable. When you open a spreadsheet containing Dividend Data formulas, the cells will typically update to show the most current information available. You can also manually recalculate or refresh the sheet to pull the latest data, ensuring your analysis always reflects the current market conditions and company fundamentals.
incentX FAQ
What types of incentives can incentX manage?
incentX is designed as a comprehensive platform to explore managing a wide range of incentive programs. It handles sales-side incentives like commissions and bonuses, as well as buy-side programs including partner/channel rebates, royalties, vendor chargebacks, and trade promotions. All are calculated from a unified transaction data foundation.
How does incentX integrate with our existing systems?
incentX is built to connect seamlessly with your core business systems. It integrates directly with popular CRM platforms (like Salesforce) and ERP systems (like SAP, Oracle NetSuite, Microsoft Dynamics) to pull in real-time transaction data. This eliminates manual data entry and ensures incentives are calculated on the most current and accurate information available.
How does incentX improve accuracy and reduce disputes?
Accuracy is achieved by automating calculations based on actual transaction data from your ERP, removing human error from spreadsheets. Disputes are reduced by providing complete transparency: every stakeholder, especially sales reps, can explore a clear, detailed breakdown of the exact transactions and rules that led to their specific payout, building trust in the process.
Is incentX suitable for small businesses or only enterprises?
incentX is versatile and designed to scale. While it powerfully handles the complex incentive structures of large enterprises, its intuitive design and automated workflows also provide immense value to growing small and medium businesses looking to move beyond spreadsheets and establish a scalable, accurate compensation process from the start.
Alternatives
Dividend Data Alternatives
Dividend Data is a specialized tool that brings decades of stock market and dividend information directly into your spreadsheet. It falls into the category of financial data platforms designed for self-directed, fundamental investors who prioritize ease of use and deep historical analysis. Users often explore other options to find a solution that perfectly aligns with their budget, the specific metrics they track, or whether they primarily use Excel versus Google Sheets. The search for an alternative is a natural part of the discovery process. You might be evaluating different pricing models, seeking a particular dataset not currently offered, or require integration with other software in your investment workflow. It's a smart way to ensure the tool you choose is the best fit for your unique strategy and technical environment. When comparing options, focus on the core elements that matter most to your research. Consider the depth and reliability of the historical data, the simplicity of accessing it within your preferred spreadsheet platform, and the total cost relative to your usage. The ideal alternative will feel like a seamless extension of your investment process, providing trustworthy data without complexity.
incentX Alternatives
incentX is a specialized platform in the incentive compensation management (ICM) category, designed to automate complex calculations for sales commissions, rebates, and royalties. It moves businesses away from manual spreadsheets by using transaction-level data from existing systems to ensure accuracy and transparency in payouts. Users often explore alternatives for various reasons. These can include budget constraints, the need for a platform that integrates with a specific niche of software, or a requirement for features tailored to a unique business model. Some may seek a simpler tool for basic commission tracking, while others might need a more comprehensive enterprise resource planning (ERP) suite that includes ICM as one module. When evaluating options, it's crucial to consider your core needs. Key factors often include the depth of system integrations, the flexibility to model complex incentive plans, the quality of real-time reporting and forecasting, and the overall scalability of the solution. The goal is to find a system that not only calculates payouts accurately but also provides the strategic insights to optimize your incentive programs for growth.