Dividend Data vs GrowPanel
Side-by-side comparison to help you choose the right AI tool.
Dividend Data
Unlock decades of stock data directly in your spreadsheet with a simple formula.
Last updated: March 11, 2026
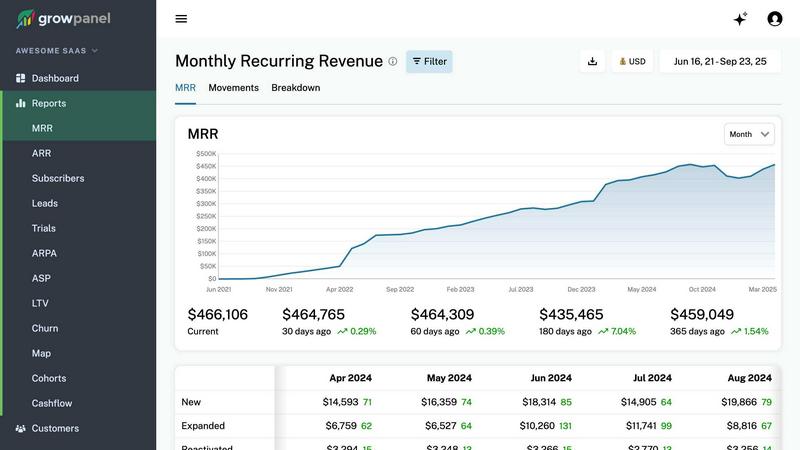
GrowPanel
Unlock real-time insights into your SaaS metrics with GrowPanel for smarter growth and improved retention.
Last updated: February 28, 2026
Visual Comparison
Dividend Data

GrowPanel
Feature Comparison
Dividend Data
Comprehensive Spreadsheet Functions
Dive deep into your analysis with 16 purpose-built custom functions that cover every essential aspect for a dividend and fundamental investor. From DIVIDENDDATA_DIVIDENDS to fetch forward yield and ex-dividend dates, to DIVIDENDDATA_RATIOS for PE Ratios and DIVIDENDDATA_METRICS for diluted EPS, these formulas act as your direct conduit to live data. Simply type them into any cell to instantly pull and refresh information, turning a static spreadsheet into a live, connected financial dashboard without any coding required.
Vast Historical & Real-Time Data Library
Satisfy your curiosity with an expansive database featuring 30+ years of historical market data across 80,000+ global tickers. This feature allows you to backtest investment theories, analyze long-term dividend growth trends, and examine financial ratios over full market cycles. Whether you're investigating a company's payout consistency through recessions or its earnings trajectory, you have decades of context at your fingertips, all accessible within seconds directly in your spreadsheet.
Dual-Platform Compatibility
Explore and analyze without constraints, as Dividend Data seamlessly integrates with both Google Sheets and Microsoft Excel. This flexibility means you can collaborate on a cloud-based Sheets document with a team or conduct deep, complex modeling in your desktop Excel application, all while using the same familiar formulas and accessing the identical, robust dataset. It ensures your workflow remains uninterrupted, regardless of your preferred spreadsheet environment.
Free Tier with Generous Monthly Credits
Begin your data exploration journey immediately with a free tier that provides 2,500 credits every month, with no trial period expiration. This allows you to thoroughly test the platform's capabilities, run numerous queries, and integrate data into your models without any upfront financial commitment. It’s an open invitation to experiment and discover how automated data can enhance your investment research process.
GrowPanel
Real-time MRR, ARR, Churn, and LTV Tracking
GrowPanel offers immediate insights into your key subscription metrics, including Monthly Recurring Revenue (MRR), Annual Recurring Revenue (ARR), churn rates, and Lifetime Value (LTV). This feature allows you to monitor your revenue health continuously, enabling timely and informed decision-making.
Trial Conversion and Cohort Analysis
Understand how users behave during their trial period with detailed cohort analysis. This feature helps you identify conversion patterns, assess retention rates over time, and optimize your onboarding processes to turn trials into paying customers effectively.
Revenue Segmentation by Plan, Country, Currency, or Custom Attributes
Customize your revenue reports by segmenting data based on different attributes such as pricing plans, geographical market, currency, or any other custom criteria. This granular approach allows you to pinpoint where your growth is coming from and tailor your strategies accordingly.
Failed Payment Tracking with Recovery Insights
Keep track of failed payments and gain insights into recovery rates to minimize involuntary churn. This feature helps you identify the root causes of payment failures and implement strategies to recover lost revenue efficiently.
Use Cases
Dividend Data
Building a Dividend Growth Screener
Curious about which companies have not only paid but consistently grown their dividends? You can build a powerful screening model directly in your spreadsheet. Use functions to pull dividend growth rates, payout ratios, and yield history for thousands of stocks. Automate the process to filter and rank companies that meet your specific criteria for sustainable dividend growth, creating a dynamic watchlist that updates with fresh data.
Conducting Deep Fundamental Analysis
When you're researching a potential investment, you need more than just a price quote. Use Dividend Data to pull complete financial statements, calculate key valuation and profitability ratios, and assess debt levels. Create a comprehensive analysis sheet for any ticker, linking cells to live data for revenue, earnings, book value, and cash flow, enabling a thorough, up-to-date fundamental review without leaving your spreadsheet.
Automated Portfolio Monitoring and Reporting
Imagine having a portfolio tracker that updates itself. By linking your holdings to Dividend Data's functions, you can automatically pull current prices, dividend announcements, and yield-on-cost for each position. Aggregate this data to see your portfolio's total income, overall valuation changes, and sector exposure in real-time, transforming a simple list of stocks into a dynamic performance dashboard.
Historical Backtesting of Investment Strategies
What would a strategy based on low PE ratios and high dividend yields have returned over the past 20 years? With access to 30+ years of historical data, you can backtest quantitative strategies directly in Excel or Sheets. Pull historical prices, dividends, and financial metrics for relevant periods to model returns and risk, allowing you to explore the historical efficacy of your investment hypotheses with concrete data.
GrowPanel
Optimize Subscription Pricing Strategies
By analyzing churn rates and customer lifetime value, SaaS companies can identify which pricing plans are most effective. GrowPanel’s insights enable businesses to optimize their pricing strategies to maximize revenue and customer satisfaction.
Enhance Customer Retention Efforts
With detailed cohort analysis, companies can track retention rates and understand customer behavior over time. GrowPanel empowers teams to implement targeted retention strategies, ensuring that they keep their most valuable customers engaged.
Streamline Financial Reporting Processes
GrowPanel simplifies financial reporting by providing a comprehensive view of cash flow, including fees, taxes, and refunds. This clarity allows financial teams to focus on strategy rather than spending time on manual data compilation and analysis.
Monitor and React to Market Trends
The platform's real-time analytics feature allows businesses to spot seasonal trends and anomalies. Companies can react quickly to market changes, ensuring they capitalize on opportunities and mitigate risks effectively.
Overview
About Dividend Data
What if you could transform your familiar spreadsheet into a dynamic, real-time research terminal? Dividend Data does exactly that, unlocking a world of institutional-grade financial data with the simplicity of a custom formula. Built by a dividend investor for like-minded analysts, this powerful tool brings over 30 years of historical and current market data for more than 80,000 tickers directly into your Google Sheets or Microsoft Excel workspace. Imagine no longer needing to manually copy-paste figures, hunt for API keys, or write a single line of code. The core magic lies in its custom functions; you simply type a formula like =DIVIDENDDATA_DIVIDENDS("MSFT") and watch as live data on dividends, yields, and payout ratios instantly populates your cell. It’s designed for the fundamental investor who craves depth—offering access to dividends, financial statements, earnings, key ratios, price history, and over 100 other metrics—but without the intimidating complexity or cost typically associated with professional data feeds. With a generous free tier offering 2,500 monthly credits that never expire, Dividend Data invites you to start exploring the markets with a curious, data-driven mindset right from your most trusted analytical environment.
About GrowPanel
GrowPanel is an innovative subscription analytics platform specifically designed for SaaS companies that seek clarity in their revenue metrics without getting lost in spreadsheet chaos. By seamlessly connecting to popular billing platforms like Stripe, Chargebee, and Recurly, GrowPanel provides instant access to beautifully designed dashboards that display critical metrics such as Monthly Recurring Revenue (MRR), Annual Recurring Revenue (ARR), churn rates, retention figures, expansion revenue, and detailed cohort analysis. With real-time updates, GrowPanel empowers businesses to make informed decisions quickly, ensuring they can react to changing market dynamics and customer behaviors. This tool is ideal for SaaS founders, CFOs, and financial analysts who want to streamline their revenue tracking and gain actionable insights into their business performance. With a commitment to transparency and efficiency, GrowPanel is free to use until your company reaches $200k ARR, making it an accessible choice for startups and high-growth businesses alike.
Frequently Asked Questions
Dividend Data FAQ
How do I get started with Dividend Data?
Getting started is a simple exploration. For Google Sheets, install the add-on from the Google Workspace Marketplace. For Microsoft Excel, get the add-in from Microsoft AppSource. Once installed, you can immediately start using the custom functions like =DIVIDENDDATA_QUOTE("AAPL", "price") in your spreadsheets. No API key configuration is needed, and your free monthly credits are available right away.
What is included in the free tier?
The free tier is designed for curious investors to begin their discovery. It includes 2,500 credits per month, which never expire, allowing you to make a substantial number of data queries. You get full access to all 16 custom functions and the vast database of historical and current data, enabling significant analysis without any cost. It's a fully-featured introduction to the platform's capabilities.
What kind of data can I access?
Your curiosity can span a wide range of financial data. You have instant access to dividend-specific information (amounts, yields, dates, growth), real-time quotes, over 30 years of price history, complete financial statements (income, balance sheet, cash flow), and key fundamental ratios (P/E, P/B, Debt/Equity). In total, you can explore over 100 different metrics for more than 80,000 global stocks and ETFs.
Does the data update automatically in my spreadsheet?
Yes, the data is designed to be live and refreshable. When you open a spreadsheet containing Dividend Data formulas, the cells will typically update to show the most current information available. You can also manually recalculate or refresh the sheet to pull the latest data, ensuring your analysis always reflects the current market conditions and company fundamentals.
GrowPanel FAQ
What billing platforms can I connect to GrowPanel?
GrowPanel allows integration with popular billing platforms including Stripe, Chargebee, Recurly, and others. This flexibility ensures that you can easily connect your existing infrastructure for seamless data flow.
Is GrowPanel suitable for startups?
Yes, GrowPanel is designed to cater to companies of all sizes, including startups. It is free until you reach $200k ARR, making it an excellent choice for emerging SaaS businesses looking for clarity in their revenue metrics without upfront costs.
How does the AI chat feature work?
The AI chat feature enables users to query their metrics using plain language. You can ask specific questions about your business performance, and the AI will provide instant, relevant answers, simplifying data exploration and analysis.
Can I access GrowPanel on mobile devices?
Absolutely! GrowPanel is mobile-friendly, allowing users to access all reports and dashboards on their smartphones. You can switch accounts, apply filters, and explore metrics with full functionality, ensuring you stay informed on the go.
Alternatives
Dividend Data Alternatives
Dividend Data is a specialized tool that brings decades of stock market and dividend information directly into your spreadsheet. It falls into the category of financial data platforms designed for self-directed, fundamental investors who prioritize ease of use and deep historical analysis. Users often explore other options to find a solution that perfectly aligns with their budget, the specific metrics they track, or whether they primarily use Excel versus Google Sheets. The search for an alternative is a natural part of the discovery process. You might be evaluating different pricing models, seeking a particular dataset not currently offered, or require integration with other software in your investment workflow. It's a smart way to ensure the tool you choose is the best fit for your unique strategy and technical environment. When comparing options, focus on the core elements that matter most to your research. Consider the depth and reliability of the historical data, the simplicity of accessing it within your preferred spreadsheet platform, and the total cost relative to your usage. The ideal alternative will feel like a seamless extension of your investment process, providing trustworthy data without complexity.
GrowPanel Alternatives
GrowPanel is a robust subscription analytics platform tailored for SaaS companies aiming to streamline their revenue metrics. This tool empowers users by providing real-time insights into essential financial indicators such as monthly recurring revenue (MRR), churn rates, and lifetime value (LTV) without the hassle of extensive spreadsheets. As businesses grow and evolve, users often seek alternatives to find solutions that better fit their specific needs, whether it be pricing structures, feature sets, or compatibility with existing platforms. When exploring alternatives, it is vital to consider factors such as the comprehensiveness of the analytics offered, ease of integration with current billing systems, and the overall user experience. Additionally, potential users should evaluate any unique features that could provide specific insights tailored to their business model, as well as the level of customer support available. Understanding these elements can help ensure that the chosen platform aligns perfectly with the company's growth objectives.