Dividend Data vs Portfolio Genius
Side-by-side comparison to help you choose the right AI tool.
Dividend Data
Unlock decades of stock data directly in your spreadsheet with a simple formula.
Last updated: March 11, 2026
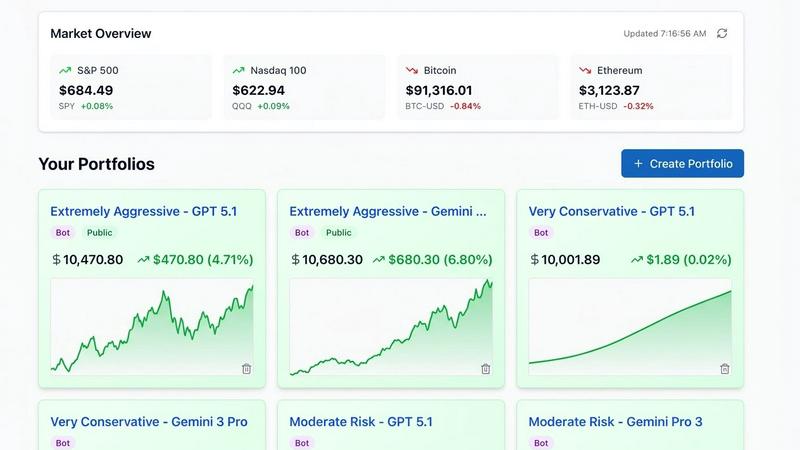
Portfolio Genius
Discover Portfolio Genius, the AI tool that analyzes your investments 24/7, offering smart trade insights and real-time.
Last updated: March 1, 2026
Visual Comparison
Dividend Data

Portfolio Genius
Feature Comparison
Dividend Data
Comprehensive Spreadsheet Functions
Dive deep into your analysis with 16 purpose-built custom functions that cover every essential aspect for a dividend and fundamental investor. From DIVIDENDDATA_DIVIDENDS to fetch forward yield and ex-dividend dates, to DIVIDENDDATA_RATIOS for PE Ratios and DIVIDENDDATA_METRICS for diluted EPS, these formulas act as your direct conduit to live data. Simply type them into any cell to instantly pull and refresh information, turning a static spreadsheet into a live, connected financial dashboard without any coding required.
Vast Historical & Real-Time Data Library
Satisfy your curiosity with an expansive database featuring 30+ years of historical market data across 80,000+ global tickers. This feature allows you to backtest investment theories, analyze long-term dividend growth trends, and examine financial ratios over full market cycles. Whether you're investigating a company's payout consistency through recessions or its earnings trajectory, you have decades of context at your fingertips, all accessible within seconds directly in your spreadsheet.
Dual-Platform Compatibility
Explore and analyze without constraints, as Dividend Data seamlessly integrates with both Google Sheets and Microsoft Excel. This flexibility means you can collaborate on a cloud-based Sheets document with a team or conduct deep, complex modeling in your desktop Excel application, all while using the same familiar formulas and accessing the identical, robust dataset. It ensures your workflow remains uninterrupted, regardless of your preferred spreadsheet environment.
Free Tier with Generous Monthly Credits
Begin your data exploration journey immediately with a free tier that provides 2,500 credits every month, with no trial period expiration. This allows you to thoroughly test the platform's capabilities, run numerous queries, and integrate data into your models without any upfront financial commitment. It’s an open invitation to experiment and discover how automated data can enhance your investment research process.
Portfolio Genius
AI Portfolio Management Tool
This tool continuously analyzes your holdings around the clock, providing real-time analytics and smart trade suggestions. The AI capabilities ensure that you receive data-driven insights that can help you optimize your investment strategy and maximize your returns.
Real-Time Analytics
Portfolio Genius offers live market data and comprehensive performance metrics updated in real-time across all of your holdings. This feature equips investors with the most current information, allowing for swift, informed decision-making.
Smart Trade Management
With this feature, users can effortlessly log and track their trades, gaining detailed insights into trading patterns and win rates. This helps investors understand their trading behavior and refine their strategies for better outcomes.
AI-Powered Portfolio Analysis Tools
The platform's AI portfolio analyzer integrates multiple data sources to deliver intelligent analysis and actionable insights. This is beneficial for both beginners looking to learn and experts seeking advanced data-driven strategies.
Use Cases
Dividend Data
Building a Dividend Growth Screener
Curious about which companies have not only paid but consistently grown their dividends? You can build a powerful screening model directly in your spreadsheet. Use functions to pull dividend growth rates, payout ratios, and yield history for thousands of stocks. Automate the process to filter and rank companies that meet your specific criteria for sustainable dividend growth, creating a dynamic watchlist that updates with fresh data.
Conducting Deep Fundamental Analysis
When you're researching a potential investment, you need more than just a price quote. Use Dividend Data to pull complete financial statements, calculate key valuation and profitability ratios, and assess debt levels. Create a comprehensive analysis sheet for any ticker, linking cells to live data for revenue, earnings, book value, and cash flow, enabling a thorough, up-to-date fundamental review without leaving your spreadsheet.
Automated Portfolio Monitoring and Reporting
Imagine having a portfolio tracker that updates itself. By linking your holdings to Dividend Data's functions, you can automatically pull current prices, dividend announcements, and yield-on-cost for each position. Aggregate this data to see your portfolio's total income, overall valuation changes, and sector exposure in real-time, transforming a simple list of stocks into a dynamic performance dashboard.
Historical Backtesting of Investment Strategies
What would a strategy based on low PE ratios and high dividend yields have returned over the past 20 years? With access to 30+ years of historical data, you can backtest quantitative strategies directly in Excel or Sheets. Pull historical prices, dividends, and financial metrics for relevant periods to model returns and risk, allowing you to explore the historical efficacy of your investment hypotheses with concrete data.
Portfolio Genius
Individual Investors
For individual investors, Portfolio Genius serves as a personal investment advisor that simplifies the decision-making process. With tailored trade suggestions and real-time analytics, users can effectively manage their portfolios without feeling overwhelmed.
Busy Professionals
For busy professionals who lack the time to conduct extensive market research, Portfolio Genius provides automated insights and smart recommendations. This feature allows them to stay engaged with their investments without sacrificing precious time.
Beginners
New investors can leverage Portfolio Genius to learn about the investment landscape in a structured manner. The platform offers educational resources and easy-to-understand analytics, making it a great starting point for anyone new to investing.
Experienced Traders
Experienced traders can utilize the advanced AI features of Portfolio Genius to enhance their existing strategies. With comprehensive market analysis and data-driven insights, they can refine their portfolios and make more informed trading decisions.
Overview
About Dividend Data
What if you could transform your familiar spreadsheet into a dynamic, real-time research terminal? Dividend Data does exactly that, unlocking a world of institutional-grade financial data with the simplicity of a custom formula. Built by a dividend investor for like-minded analysts, this powerful tool brings over 30 years of historical and current market data for more than 80,000 tickers directly into your Google Sheets or Microsoft Excel workspace. Imagine no longer needing to manually copy-paste figures, hunt for API keys, or write a single line of code. The core magic lies in its custom functions; you simply type a formula like =DIVIDENDDATA_DIVIDENDS("MSFT") and watch as live data on dividends, yields, and payout ratios instantly populates your cell. It’s designed for the fundamental investor who craves depth—offering access to dividends, financial statements, earnings, key ratios, price history, and over 100 other metrics—but without the intimidating complexity or cost typically associated with professional data feeds. With a generous free tier offering 2,500 monthly credits that never expire, Dividend Data invites you to start exploring the markets with a curious, data-driven mindset right from your most trusted analytical environment.
About Portfolio Genius
Portfolio Genius is an innovative AI-powered investment advisor that aims to transform the way individuals manage their investment portfolios. By harnessing advanced algorithms and real-time data analytics, this platform provides insightful trade suggestions that are specifically tailored to each user's unique investment profile and prevailing market conditions. Whether you are an individual investor navigating the complexities of the market, a busy professional with limited time, a beginner eager to learn the fundamentals, or an experienced trader seeking AI-enhanced insights to refine your strategies, Portfolio Genius has something to offer. Its core value proposition lies in delivering intelligent recommendations based on thorough market analysis, enabling users to make informed decisions with ease. With features such as automated trading, a conversational interface, and comprehensive portfolio tracking, Portfolio Genius empowers users to confidently and clearly navigate the investment landscape, ensuring that they can achieve their financial goals.
Frequently Asked Questions
Dividend Data FAQ
How do I get started with Dividend Data?
Getting started is a simple exploration. For Google Sheets, install the add-on from the Google Workspace Marketplace. For Microsoft Excel, get the add-in from Microsoft AppSource. Once installed, you can immediately start using the custom functions like =DIVIDENDDATA_QUOTE("AAPL", "price") in your spreadsheets. No API key configuration is needed, and your free monthly credits are available right away.
What is included in the free tier?
The free tier is designed for curious investors to begin their discovery. It includes 2,500 credits per month, which never expire, allowing you to make a substantial number of data queries. You get full access to all 16 custom functions and the vast database of historical and current data, enabling significant analysis without any cost. It's a fully-featured introduction to the platform's capabilities.
What kind of data can I access?
Your curiosity can span a wide range of financial data. You have instant access to dividend-specific information (amounts, yields, dates, growth), real-time quotes, over 30 years of price history, complete financial statements (income, balance sheet, cash flow), and key fundamental ratios (P/E, P/B, Debt/Equity). In total, you can explore over 100 different metrics for more than 80,000 global stocks and ETFs.
Does the data update automatically in my spreadsheet?
Yes, the data is designed to be live and refreshable. When you open a spreadsheet containing Dividend Data formulas, the cells will typically update to show the most current information available. You can also manually recalculate or refresh the sheet to pull the latest data, ensuring your analysis always reflects the current market conditions and company fundamentals.
Portfolio Genius FAQ
Does Portfolio Genius provide investment advice?
No, Portfolio Genius does not provide direct investment advice. Instead, it serves as a portfolio tracking and analytics platform that offers educational insights and data-driven analysis to help users make informed decisions.
How does the AI analyze my portfolio?
The AI continuously processes a variety of data sources, including real-time stock prices, financial fundamentals, and market news. This integrated approach allows it to provide intelligent insights tailored to your unique investment profile.
Can I try Portfolio Genius for free?
Yes, Portfolio Genius offers a 7-day free trial for users to experience its features and capabilities without any commitment. You can explore the platform and see how it can enhance your investment strategy.
What security measures does Portfolio Genius have?
Portfolio Genius prioritizes your data security by employing bank-grade encryption and enterprise-level security standards. This ensures that your personal and financial information is protected at all times.
Alternatives
Dividend Data Alternatives
Dividend Data is a specialized tool that brings decades of stock market and dividend information directly into your spreadsheet. It falls into the category of financial data platforms designed for self-directed, fundamental investors who prioritize ease of use and deep historical analysis. Users often explore other options to find a solution that perfectly aligns with their budget, the specific metrics they track, or whether they primarily use Excel versus Google Sheets. The search for an alternative is a natural part of the discovery process. You might be evaluating different pricing models, seeking a particular dataset not currently offered, or require integration with other software in your investment workflow. It's a smart way to ensure the tool you choose is the best fit for your unique strategy and technical environment. When comparing options, focus on the core elements that matter most to your research. Consider the depth and reliability of the historical data, the simplicity of accessing it within your preferred spreadsheet platform, and the total cost relative to your usage. The ideal alternative will feel like a seamless extension of your investment process, providing trustworthy data without complexity.
Portfolio Genius Alternatives
Portfolio Genius is an AI-driven investment advisor designed to redefine the investment management experience. By leveraging advanced algorithms and real-time data analytics, it provides personalized trade suggestions and insights tailored to each user's investment profile and market conditions. This tool appeals to a broad audience, including individual investors, busy professionals, and seasoned traders seeking AI-enhanced strategies. Users often seek alternatives to Portfolio Genius for various reasons, including pricing considerations, feature sets that better match their specific needs, or platform compatibility with other tools they currently use. When evaluating alternatives, it's essential to consider factors such as the quality of AI recommendations, the flexibility in trading options, user interface design, and the overall reliability of the platform.