Simple Analytics

About Simple Analytics
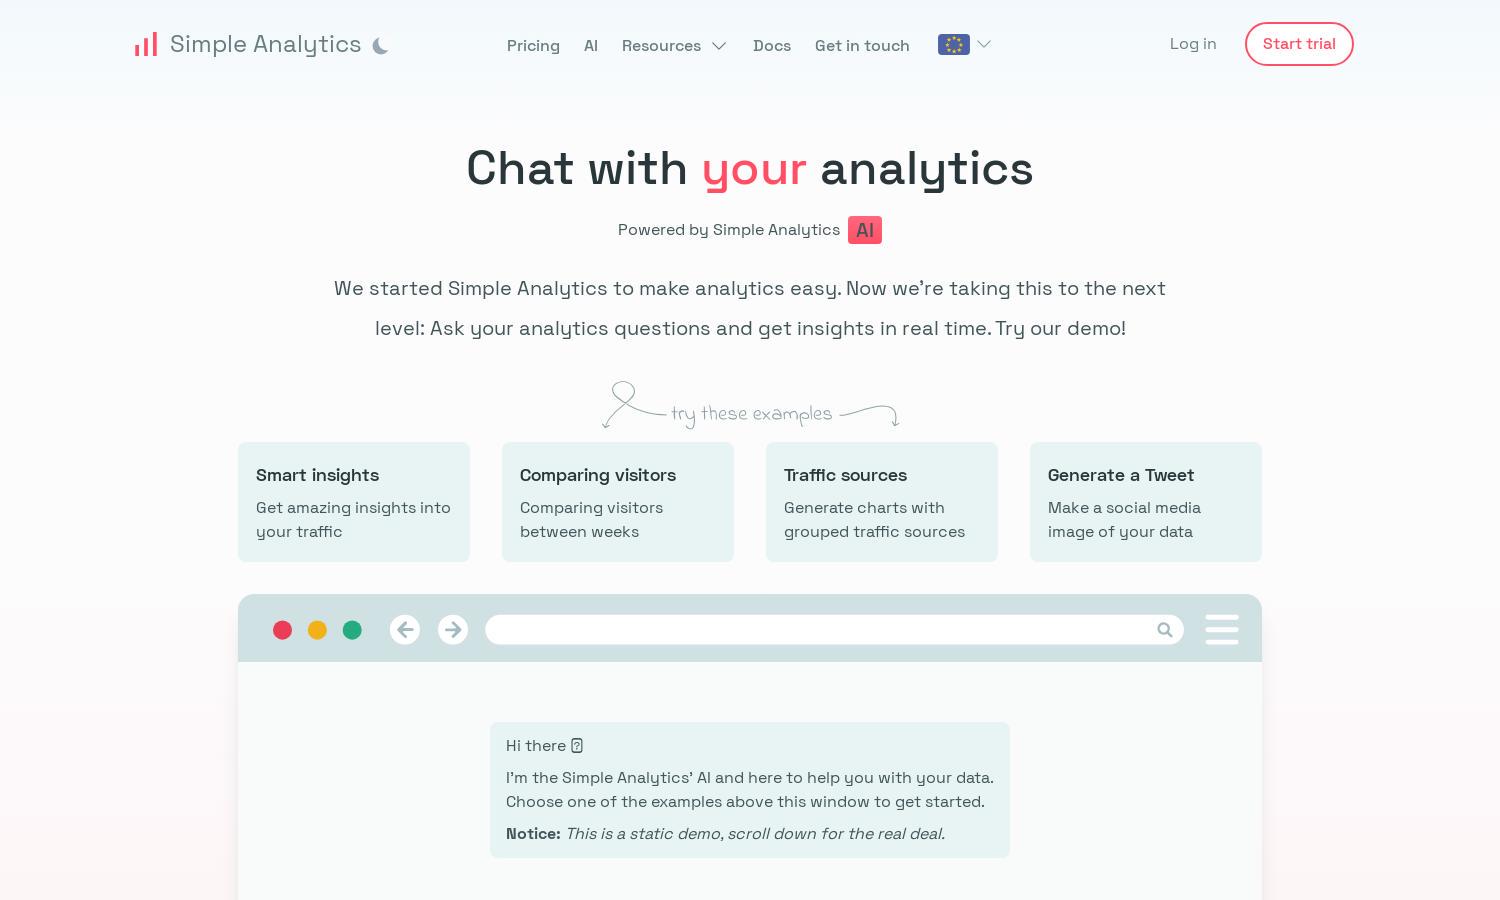
Simple Analytics is a cutting-edge platform designed for businesses and individuals seeking intuitive analytics. It allows users to interact with their data via chat, generating real-time insights and customizable charts. By simplifying data analysis, Simple Analytics transforms complex information into actionable knowledge, catering to diverse analytical needs.
Simple Analytics offers a free 14-day trial with no credit card required. After the trial, users can choose a subscription plan that suits their needs, ensuring access to advanced features and ongoing support. Upgrading provides additional capabilities that enhance data analysis and visualization for optimal user experience.
The user interface of Simple Analytics is designed for maximum efficiency, featuring a clean, intuitive layout that enhances navigation. Users can easily access various tools to analyze their data through interactive chats and stunning visualizations. Simple Analytics prioritizes user experience with its seamless browsing and effective design elements.
How Simple Analytics works
To get started with Simple Analytics, users first sign up for a free trial, allowing them to explore the platform's capabilities. Upon onboarding, they can interact with their analytics data via a chat interface, asking questions to uncover insights. The platform generates real-time charts and reports, streamlining the data analysis process while ensuring user-friendly access to information.
Key Features for Simple Analytics
Real-time analytics chat
Simple Analytics features a unique real-time analytics chat that enables users to interact directly with their data. This innovative approach simplifies the analytics process, allowing users to ask questions and receive instant insights, making data analysis more accessible and actionable.
Traffic source comparisons
Another key feature of Simple Analytics is its ability to compare traffic sources. Users can analyze and visualize how different channels contribute to their overall traffic, providing valuable insights that help optimize marketing strategies and enhance overall performance.
Custom chart generation
Custom chart generation is a standout feature of Simple Analytics that empowers users to create tailored visualizations of their data. This functionality allows for better representation and understanding of analytics, catering to various preferences and enhancing decision-making processes.
You may also like:


